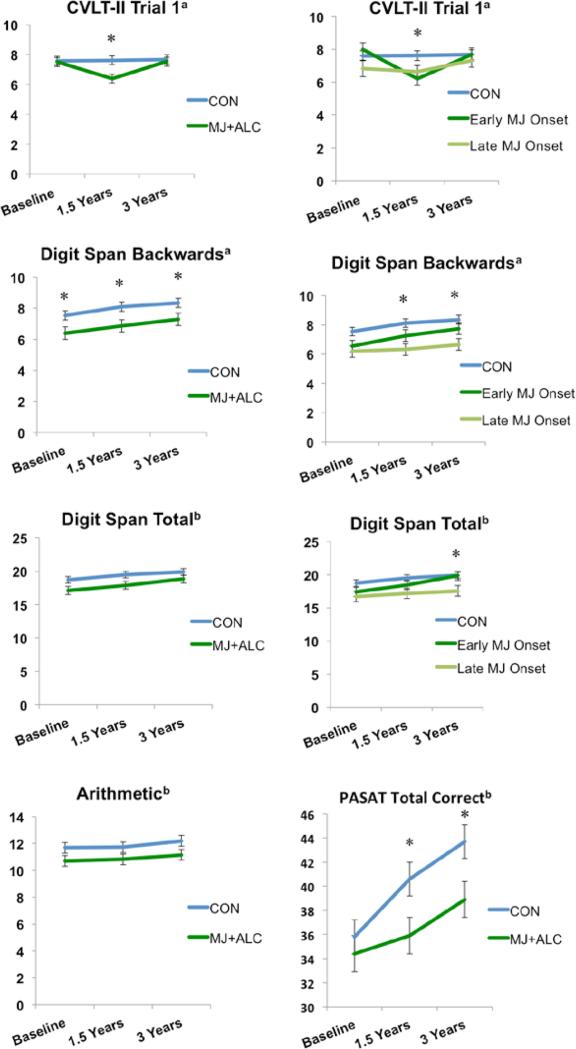
Figure 2.
Complex attention subtest performance. Raw scores presented for California Verbal Learning Test-II Trial 1, Digit Span Backwards and Total, and Paced Auditory Serial Addition Test. Scaled scores presented for Arithmetic. a p<.05, group main effect or interaction; b p≤ .07, trend for group main effect or interaction; *p<.05, group effect at each time point. Means adjusted for lifetime alcohol use.

