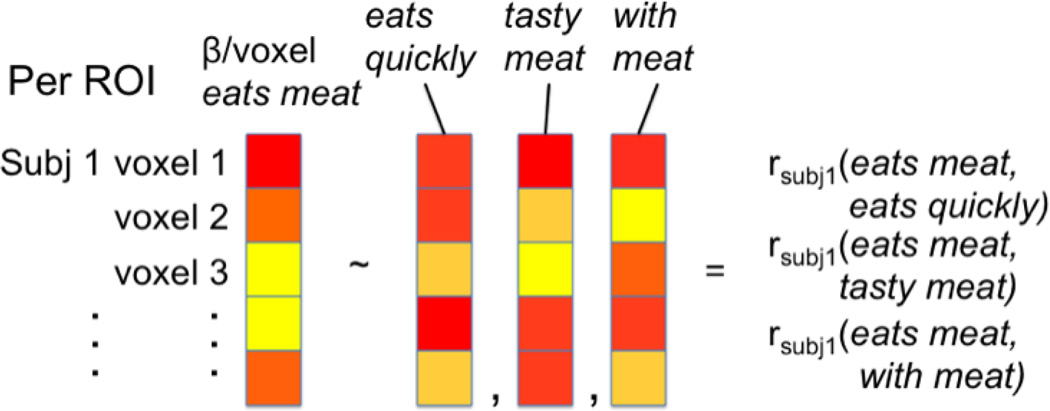
Figure 2.
Diagram of similarity analysis. A vector of the N (50, 100, 200, and 500) best voxels’ β values for a given condition (e.g. +verb_arg, or eats meat) was correlated against another vector of β values from the same voxel array for a different condition in the same composition set (e.g. +verb_adj, or eats quickly).

