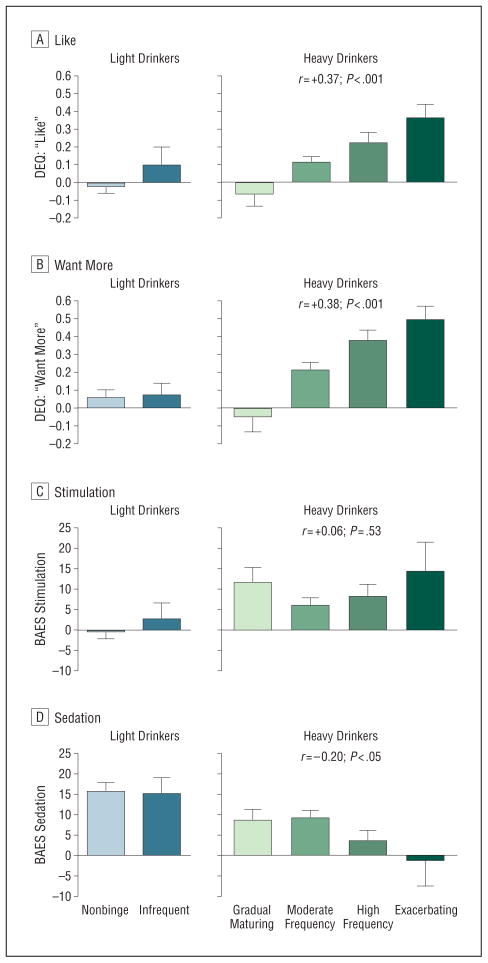
Figure 5.
Heavy and light drinkers’ trajectory groups’ initial alcohol responses, including the Drug Effects Questionnaire (DEQ; range, 0.0–1.0) for like (A) and want more (B) and the Biphasic Alcohol Effects Scale (BAES; range, 10–70) for stimulation (C) and sedation (D). Alcohol responses are indicated as the mean for each trajectory group based on participants’ change score: high dose (60 minutes - baseline) – placebo (60 minutes -baseline). In light drinkers, there were no significant associations of alcohol response to trajectory group. In heavy drinkers, higher ratings for like (P <.001) and want more (P <.001) and lower ratings for sedation (P <.05) were significantly linearly associated with drinking trajectory group. Error bars indicate standard error.

