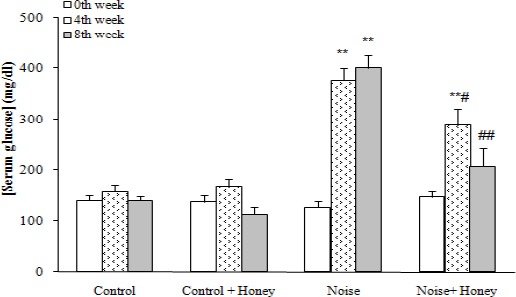
Figure 2.

Serum glucose concentration in weeks 0, 4, and 8, (means±SEM). ** P<0.01 (as compared to week 0 (baseline) in the same group); # P<0.05, ## P<0.01 (as compared to noise group in the same week)

Serum glucose concentration in weeks 0, 4, and 8, (means±SEM). ** P<0.01 (as compared to week 0 (baseline) in the same group); # P<0.05, ## P<0.01 (as compared to noise group in the same week)