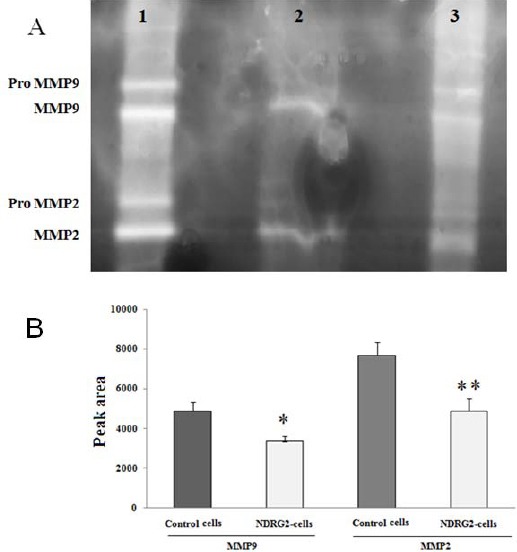
Figure 5.

Effects of N-myc downstream regulated gene 2 overexpression on matrix metaloproteinase-2 and -9 activities. (A) A representative gelatin zymograph showing MMP-2 and MMP-9 from cell culture supernatant of A549 control cells (lane 1), NDRG2 overexpressing A549 cells (lane 2). A serum sample (contain secreted MMP-2 and -9) was used as the positive control (lane 3). (B) The density of MMP-2 and -9 bands obtained in gelatin-zymographic gel (10% SDS-PAGE containing 0.1% gelatin). The activities of MMP-2 and MMP-9 were decreased in NDRG2 overexpressed cells compared to the control cells. **P< 0.01 and *P< 0.05 vs. control
