
Figure 2.
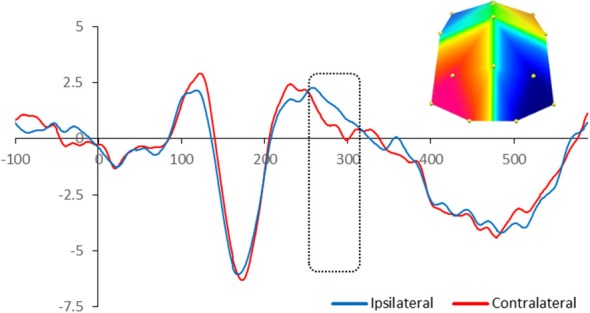
Grand-averaged waveforms for N2pc elicited by the memory array in cued trials in adults. Red lines indicate neural activity contralateral to the side of the to-be-encoded item and blue lines indicate neural activity ipsilateral to the side of the to-be-encoded item. Positive voltage is plotted upwards. The dotted box highlights the time-window during which the mean voltage difference of the N2pc was found significant. The topographic map next to the ERP waveform panel shows the lateralized difference in voltage between contralateral and ipsilateral sites during the time window in which the N2pc component was found significant. The voltage distributions are shown from posterior perspective. Blue indicates negative voltage and red indicates positive voltage.