
Fig. 2.
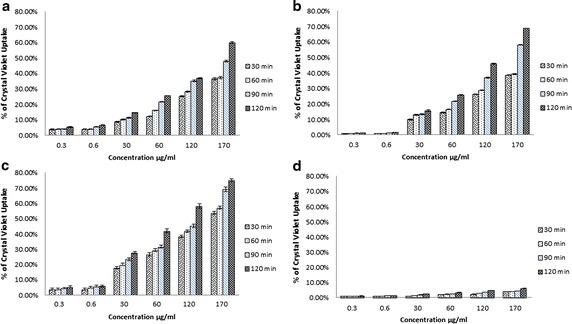
Change in bacterial (a, b E. coli; c, d S. aureus) membrane permeability (assayed by crystal violet uptake) in presence of different concentrations of CTAB (a, c) and polymyxin B (b, d). Percentage of crystal violet uptake was plotted against the concentration (µg/ml) of the treatment