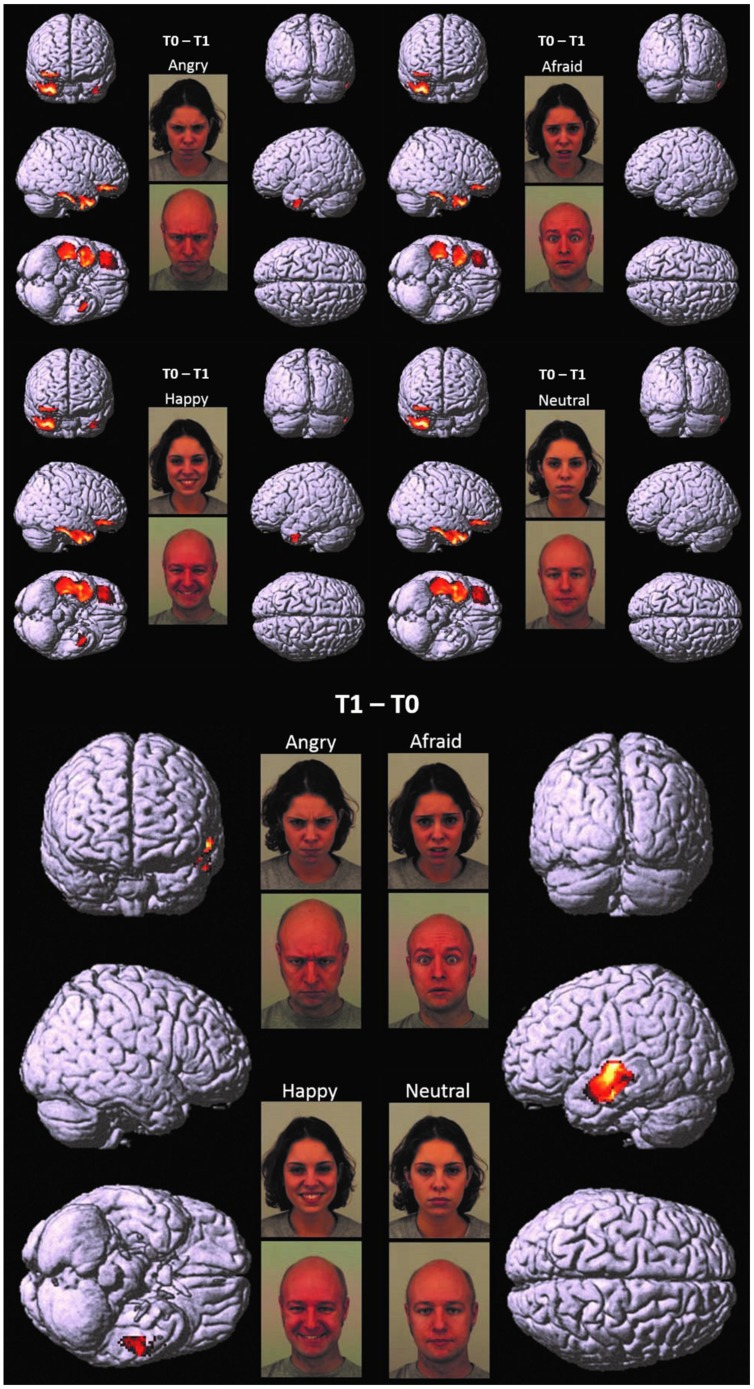
FIGURE 1.
T0 – T1 and T1 – T0. Cortical representation of the cluster of voxels in which the hdEEG signal was higher at T0 as compared to T1 (Top) and at T1 as compared to T0 (Bottom). For T0 – T1, we reported the patterns of activations in response to angry, afraid, happy, and neutral emotions, respectively. For T1 – T0, we reported only one representative pattern of activation (referred specifically to angry faces), since brain responses were elicited in a very similar fashion for all the presented emotions. Regional details are presented in Table 4.

