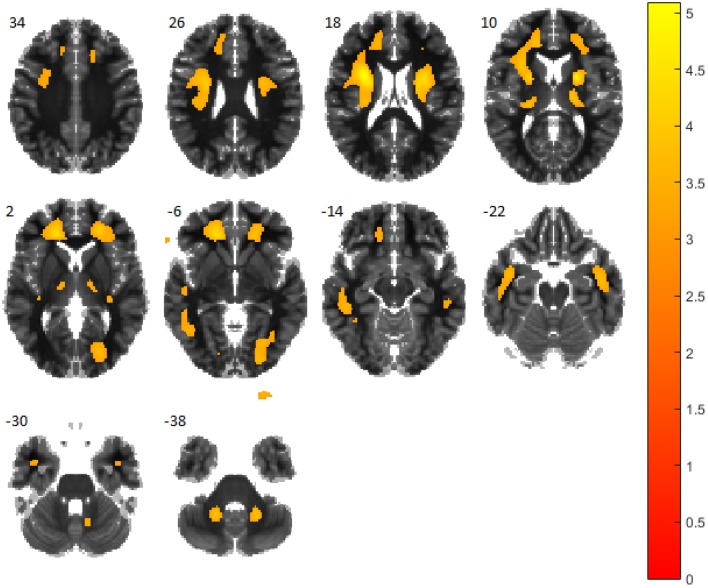
Figure 1.
t-test comparing patients with idiopathic PD and atypical parkinsonian syndromes. Regions in orange/yellow are significantly lower (p < 0.001, uncorrected) in idiopathic PD patients. Observe that most part of the thalamus, anterior cingulate gyrus and pars opercularis are covered by highlighted areas.

