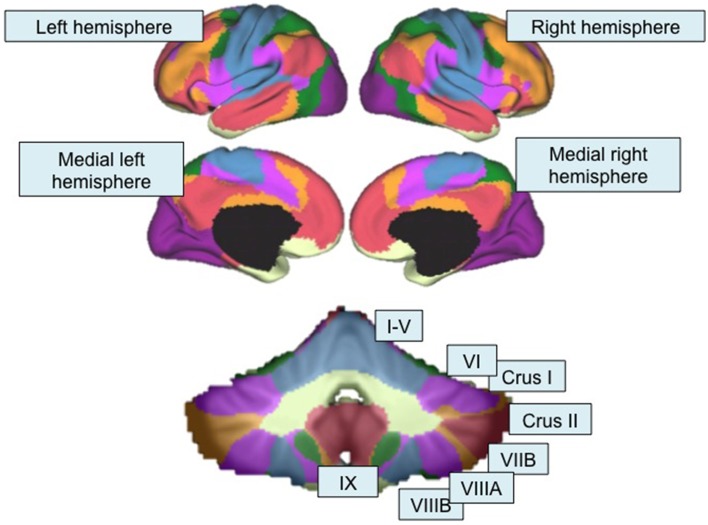
Figure 2.
Functional topography revealed by resting-state functional connectivity mapping. Top, Color-coded seven-network map of the cerebral cortex as revealed by resting-state functional connectivity (adapted with permission from Yeo et al., 2011). Bottom, resting-state functional connectivity network map of the cerebellum using the same seven-network solution (Buckner et al., 2011) from the Spatially Unbiased Infratentorial (SUIT) Atlas (Diedrichsen, 2006; Diedrichsen et al., 2009). Lobules are labeled according to the scheme shown in Figure 1. Purple, visual network; blue, somatomotor network; green, dorsal attention network; violet, ventral attention network; cream, limbic network; orange, fronto-parietal network; red, default mode network.

