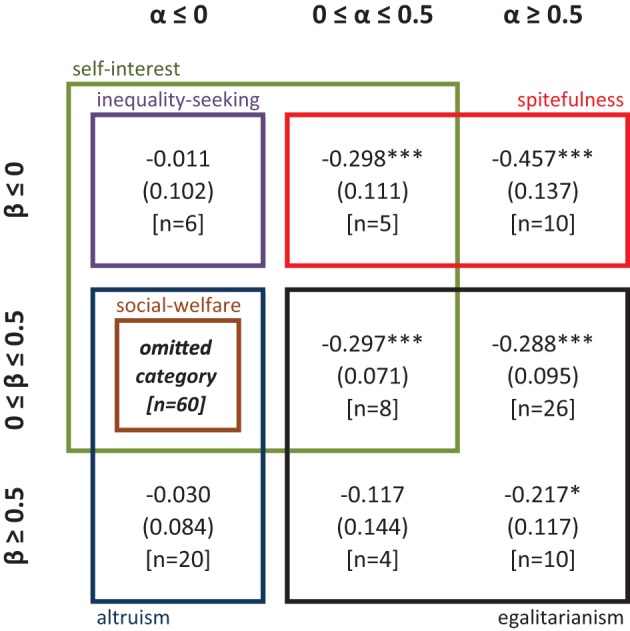
Figure 3.

Output of multinomial Probit regression (Study 1). In each cell, the figure shows the coefficient of CRT obtained by comparing that specific social preference category with “α ≤ 0, β ϵ [0, 0.5]”. *, **, *** denote p-values lower than 0.10, 0.05, and 0.01, respectively. Ll = −247.017, Wald χ2 = 45.12 (p < 0.01), N = 149. Robust standard errors clustered on individuals are shown in parentheses, and the number of observations in square brackets.
