
FIGURE 1.
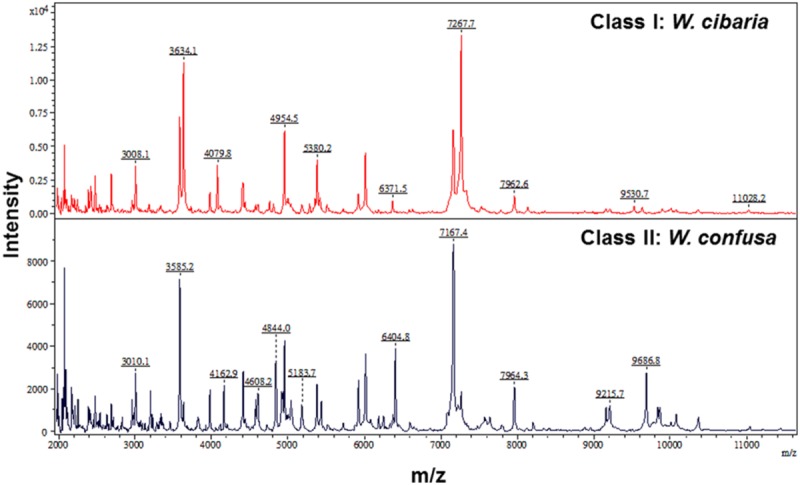
Two clusters of Weissella species spectra, i.e., cluster I (W. cibaria) and cluster II (W. confusa), analyzed by clustering analysis of MALDI-TOF MS results. The absolute intensities of the ions are shown on the y axis and the masses (m/z) of the ions are shown on the x axis. The m/z values represent the mass-to-charge ratio.