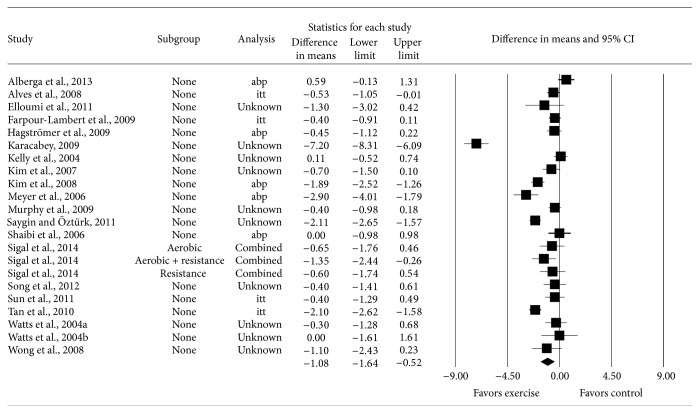
Figure 3.
Forest plot for point estimate changes in BMI in kg·m−2. The black squares represent the mean difference while the left and right extremes of the squares represent the corresponding 95% confidence intervals. The middle of the black diamond represents the overall mean difference while the left and right extremes of the diamond represent the corresponding 95% confidence intervals.

