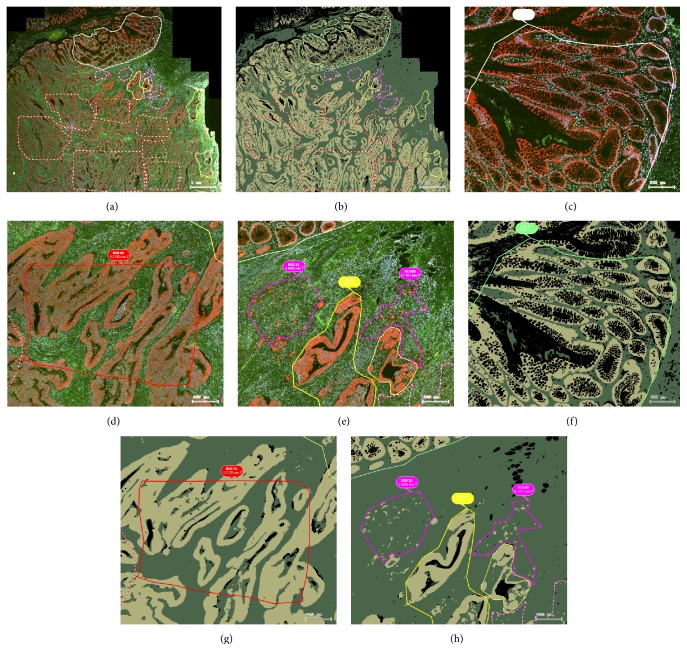
Figure 2.
Example of an image of a CRC tissue section analyzed by EPSTRA. (a) K8 staining (TxRed) overlaid with DAPI (blue) including Cy2 (green) and Cy5 (white) background fluorescence; (b) epithelial mask (yellow) and stromal mask (green) as found by EPSTRA; (c) the adjacent mucosa is depicted in green contours, (d) tumor center in red, (e) invasive front 1 in yellow, and invasive front 2 in pink; (f)–(h) show the corresponding epithelial mask of (c)–(e) views. Bubbles show the region of interest (ROI) identification number and its area. Bar indicates 200 μm.

