FIGURE 2.
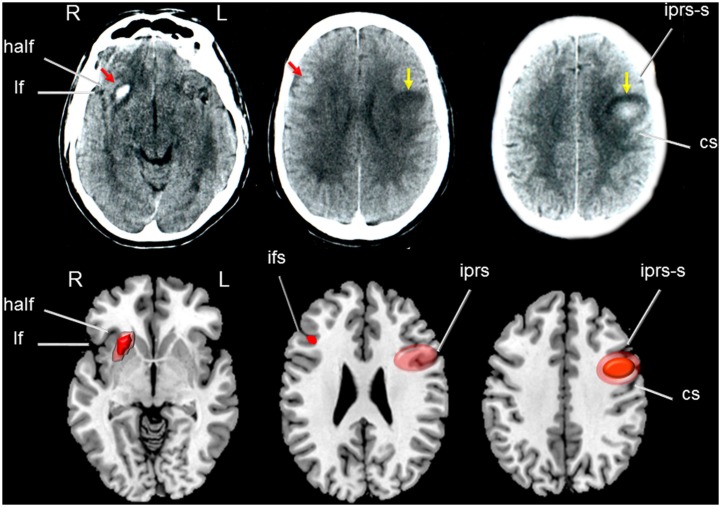
(Top) Axial high resolution CT scan of patient OM showing a small hemorrhage involving the right anterior putamen and insula with dorsal extension to the inferior frontal gyrus (red arrows in left and middle images) surrounded by mild vasogenic oedema. Yellow arrows indicate a round image of mixed density in the left sensory-motor regions consistent with a resolving hemorrhage. (Bottom) Drawings were made using MRIcro software (Rorden, C., 2005. www.mccauslandcenter.sc.edu/mricro/mricro/) on T1-weighted axial images. Areas depicting dense hemorrhages are drawn in red and areas of mixed density (hemorrhages and oedema) in light red. Fissures and sulcus are indicated with white arrows. half indicates: horizontal ascending ramus of the lateral fissure; lf: lateral fissure; iprs-s: inferior precentral sulcus, superior ramus; cs: central sulcus (sulcus of Rolando); ifs: inferior frontal sulcus; iprs: inferior precentral sulcus. Terminology and abbreviations for fissures and sulci were taken from the atlas of neuroanatomy of language regions of the human brain (Petrides, 2014). R: indicates right and L: left.

