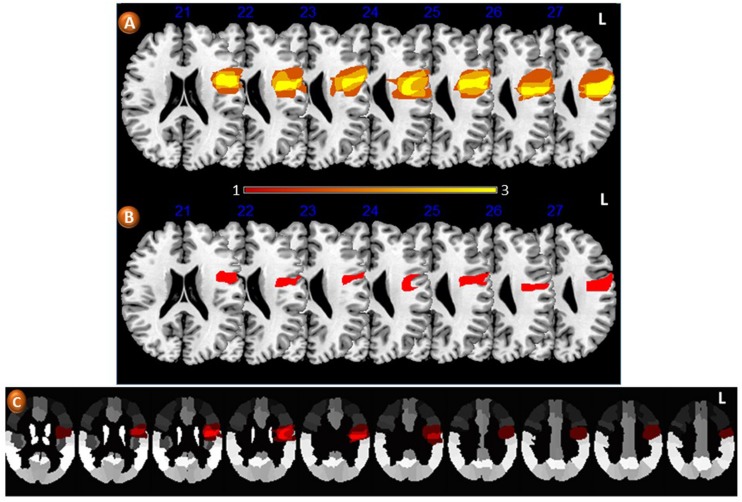
FIGURE 5.
Axial slices from T1-weighted MRI images in Montreal Neurological Institute space showing lesion overlap in three patients with loss of regional accent (A). The average lesion density shows involvement of pericentral areas which are considered key components of the large-scale network mediating speech production. The color bar below (A) indicates the number of patients contributing to the average lesion image in both groups. (B) Shows the greatest area of lesion overlap in all three patients involving the medial part of the left precentral gyrus (red). (C) Depicts the areas of lesion overlap superimposed on the Automatic Anatomical Labeling (AAL) atlas (Tzourio-Mazoyer et al., 2002). L: indicates left.

