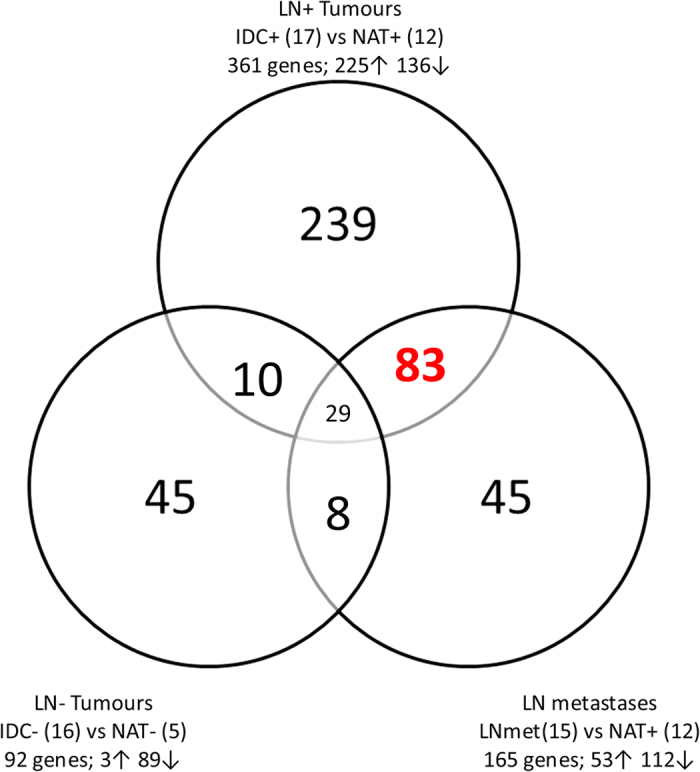
Figure 3. Venn Diagram for identification of genes associated with lymph node metastasis.

All samples are categorised in lymph node positive primary tumours (IDC+), lymph node negative primary tumours (IDC−), lymph node metastases (LNmet) and matched normal adjacent tissue for lymph node positive cases (NAT+) and lymph node negative cases (NAT−). Gene expression was analysed in all three tumour categories compared to their matched NAT samples. Highlighted in red are the 83 genes that are differentially expressed in IDC+ and LNmet samples but not in IDC− samples.
