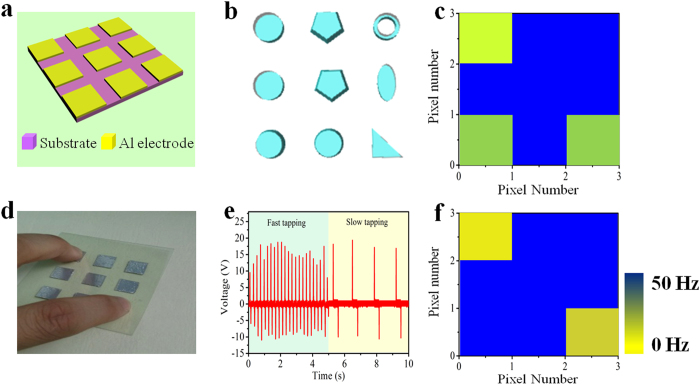
Figure 5. Demonstration of wide range of applications.
(a) The schematic diagram of the active array sensor. (b) Illustration of the simulated shapes. (c) Measured mapping figure with 3 units vibrating under different frequencies. (d) Photograph of the matrix touched by two fingers. Photograph taken by Qijie Liang. (e) The output of a single unit with one finger tapping on it fast and slowly. (f) Measured mapping figure when two pixels in the matrix in (d) were knocked by two fingers under different frequency.

