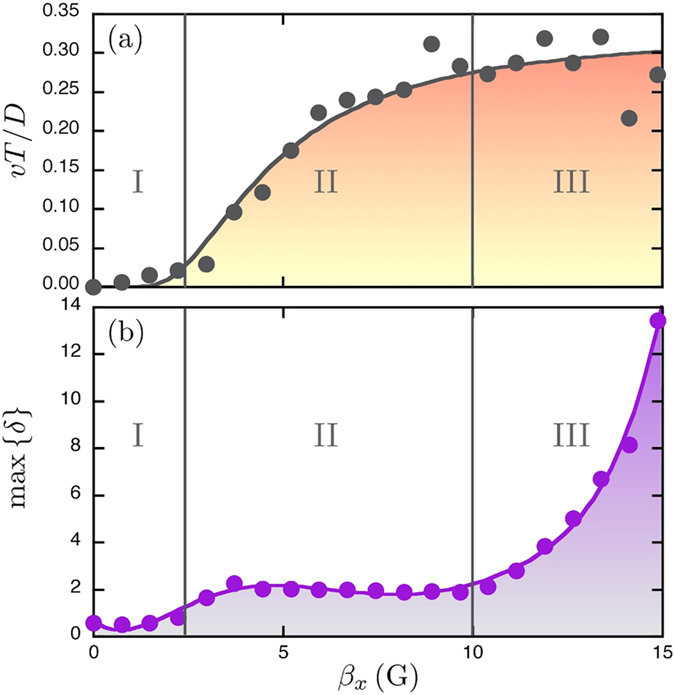
Figure 3. Swimming speeds.

(a) Average speed of the self-assembled system as a function of the amplitude of oscillations, when the offset is Bx0 = 0.75 G and f = 0.5 Hz. The velocity is seen to increase and saturates around 0.3 D/T. The curve is a guide for the eye. (b) The maximum standard deviation δ of the angles from the regular triangle as a function of the amplitude βx. The curve is a guide for the eye. Please note the large differences obtained near the collapse (βx ≈ 15 G). Three regimes (I, II and III) are indicated and are discussed in the main text.
