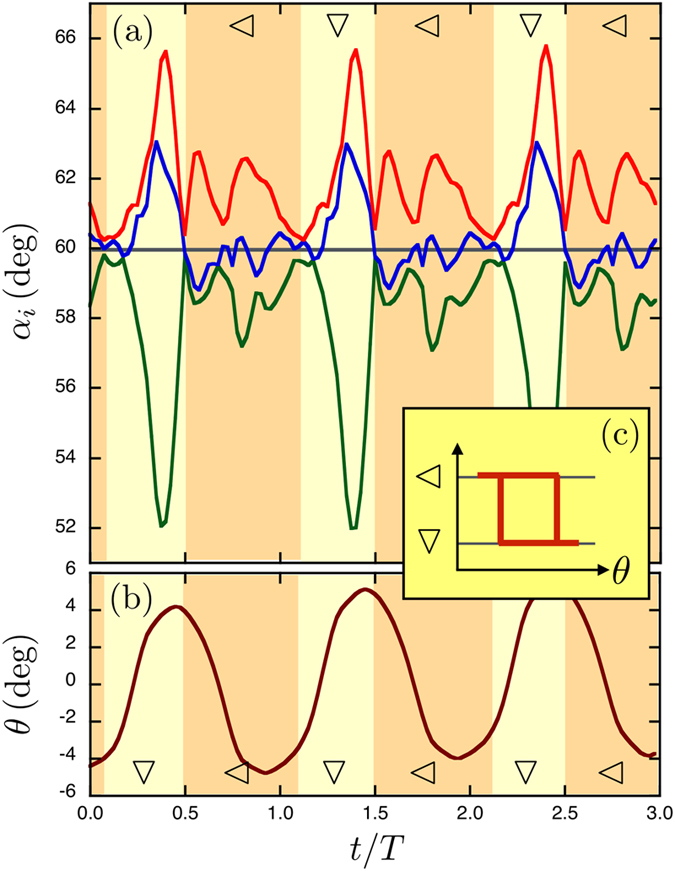
Figure 6. Non-reciprocal motion in the experiment.

(a) Three periods T of the angles αi with the same color code as in Fig. 5(a), using our experimental data. One observes that the blue curve oscillates between the red and green ones in each period. The system switches periodically between  and ∇ isosceles. (b) The angle θ of the whole structure during three periods. Oscillations are seen evidencing the successive switches. (c) This sketch shows the isosceles states as a function of θ forming a loop at each cycle, i.e. a non-reciprocal motion.
