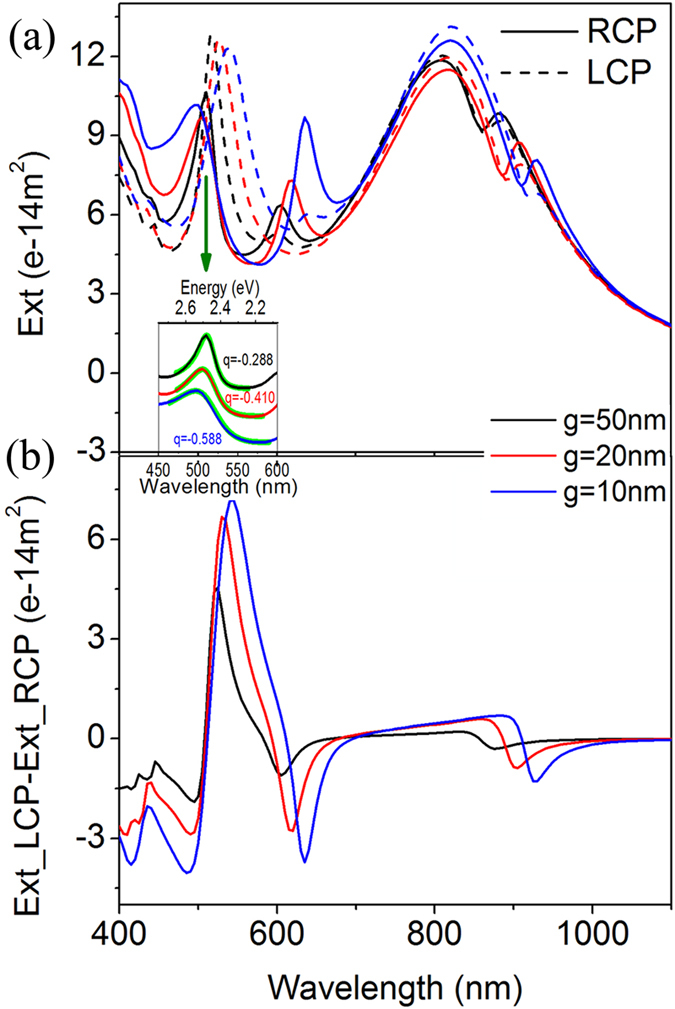
Figure 3. Optical activity with different gaps between the two nanorices.

(a) Extinction spectra of the Au-Ag dimers (l = 240 nm, d = 60 nm) with g = 10 nm (blue), 20 nm (red) and 50 nm (black) under LCP and RCP excitation. The inset shows the Fano fittings (green lines,  ) of the indicated peaks for different gaps excited with RCP. The q values reflect the asymmetry of the peaks. (b) The CD spectra of the Au-Ag heterodimers with different gaps.
