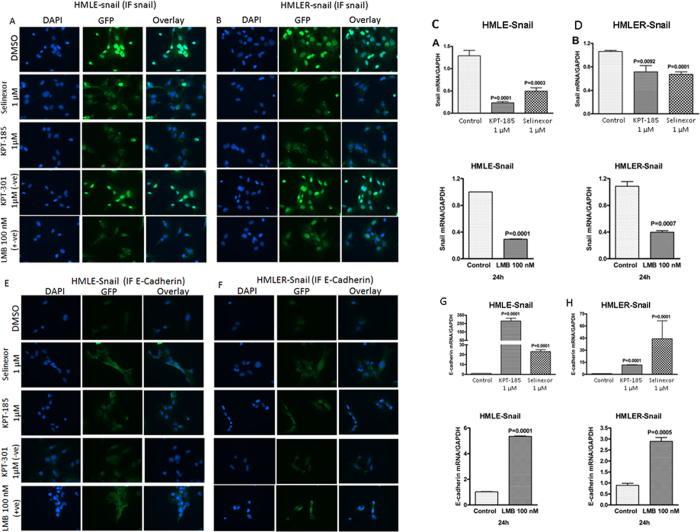
Figure 2. SINE compounds suppresses EMT markers and induces nuclear degradation of snail in HMLE-snail models.
Cells were grown at a density of 3000 cells per well in 4 well chambered slides. After 24 hrs the cells were exposed to indicated concentrations of SINE, LMB or KPT-301 (−ve control) and IF was performed as described in methods section. (A,B) Snail IF images of HMLE-snail and HMLER-snail cells exposed to 1 μM concentrations of either selinexor, KPT-185 or KPT-301(–ve control) for 24 hrs (40 ×). Note: Images showing reduction in snail upon selinexor, KPT-185, or LMB (100 nM for 24 hrs as +ve control) exposed cells that was absent in KPT-301 treatment group (used as −ve control). Data representative of three independent experiments. (C,D) HMLE-snail and HMLER-snail cells were grown in six well plates in duplicate at a density of 50,000 cells per well overnight and then exposed to either selinexor or KPT-185 for 24 hrs. RNA was isolated and RT-PCR was performed as described in methods section. Note suppression of snail mRNA in both cell models tested. Similar results were obtained by +ve control LMB exposure (100 nM for 24 hrs) (C,D lower panels). Data representative of two independent experiments (E,F) Immunofluorescence images (40×) showing enhancement in E-cadherin under similar treatment conditions. (G,H) RT-PCR analysis for E-Cadherin expression under similar treatment conditions. Data is representative of two independent experiments.

