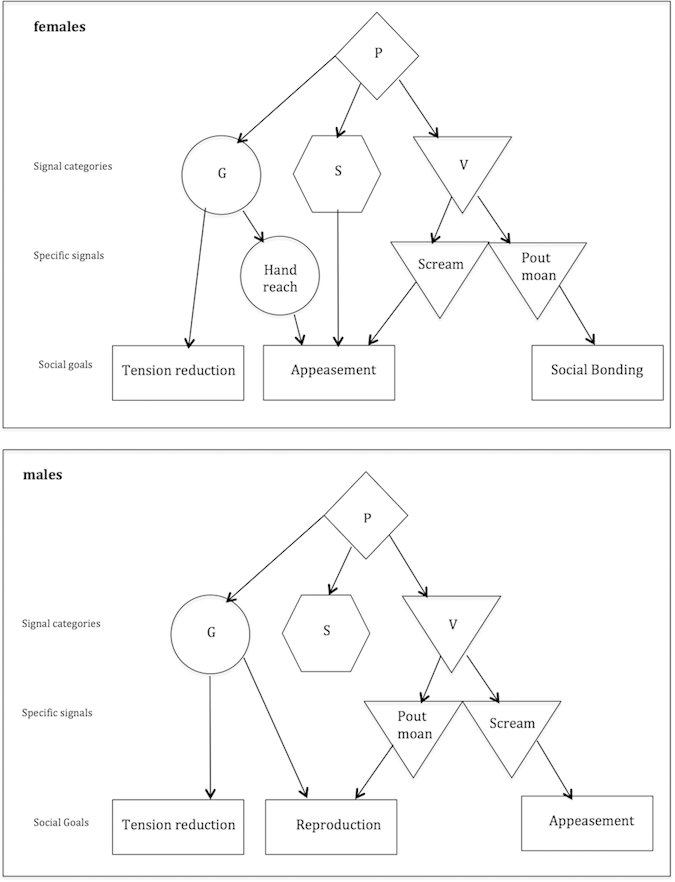
Figure 5. Summary plot of the most likely communicative strategy depending on the social goal of sex and gender of initiator.

Arrows represent the most likely scenario based on the result of the statistical models for signal categories and on the descriptive analyses of proportions for specific signals. P = Sexual initiation posture; G = Gesture; S = Sequence; V = Vocalisation.
