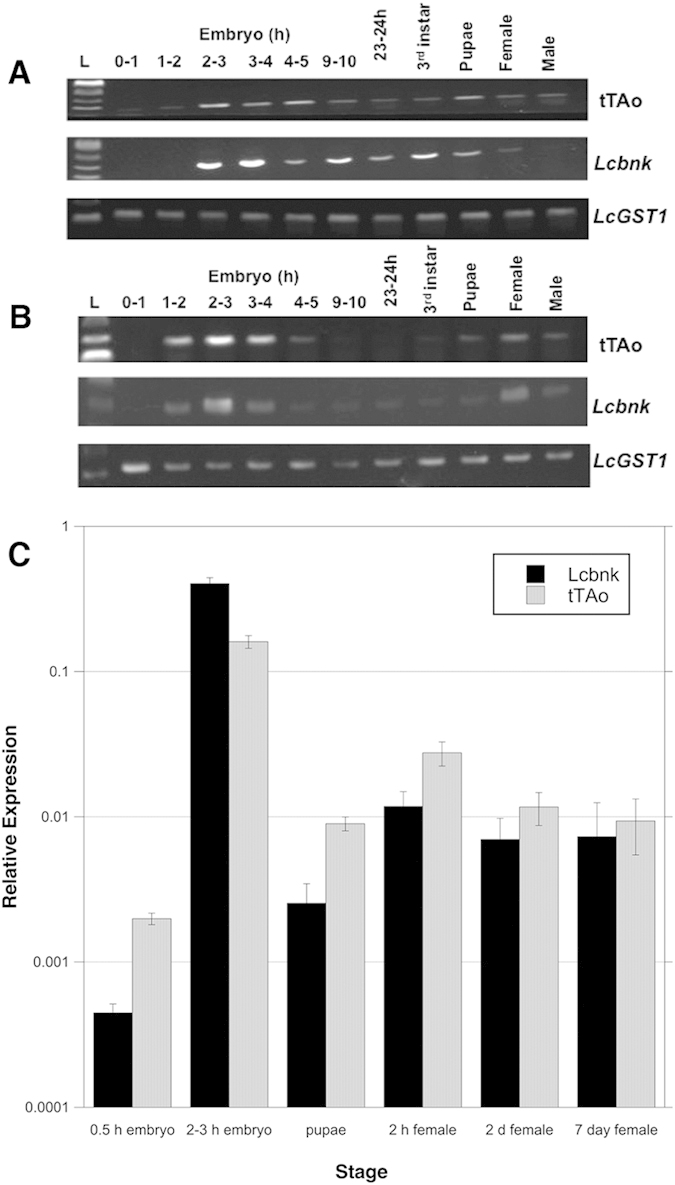
Figure 1. tTAo expression at different developmental stages.

tTAo transcript levels in the DR2–6# (A) and DR2–7# (B) lines was analyzed by RT-PCR (34 cycles). The sizes of RT-PCR products are: 165 bp for tTAo, 203 bp for Lcbnk and 121 bp for LcGST1. (C) Lcbnk and tTAo relative expression levels at different developmental stages in the DR2#6 line as determined by quantitative RT-PCR. RNA levels are relative to the LcGST1 reference gene. Mean and standard error from three measurements are shown.
