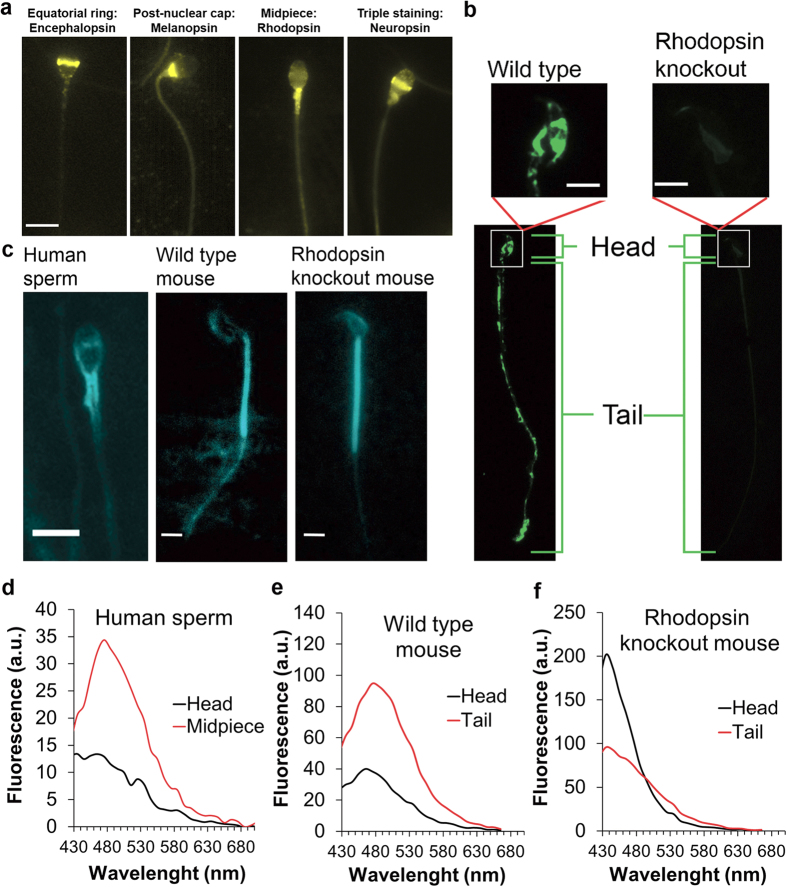
Figure 3. Localization of rhodopsin and retinal in mammalian spermatozoa.
(a) Representative images showing the different locations of opsins in human spermatozoa, revealed by immunocytochemical analysis. The anti-rhodopsin antibody was H-300. Bar = 5 μm. (b) Representative immunocytochemical staining of rhodopsin in mouse spermatozoa retrieved from wild-type and rhodopsin-knockout mice. Bar = 5 μm. (c) Representative TIRF images of human and mouse spermatozoa. Excitation was at 473 nm and emission at 535 ± 15 nm. Bar = 5 μm. (d) Emission spectra of the head and midpiece of human spermatozoa obtained by confocal microscopy (Ex = 406 nm). The spectra are the averages of 30 heads and 25 midpieces. (e) Emission spectra of the head and tail of wild-type mouse spermatozoa obtained by confocal microscopy (Ex = 406 nm). The spectra are the averages of 14 heads and 20 tails. The tails included the midpiece. (f) Emission spectra as in panel e but from rhodopsin-knockout mice. The spectra are the averages of 15 heads and 22 tails.

