
Figure 6. Involvement of cyclic-nucleotide signalling in sperm thermotaxis.
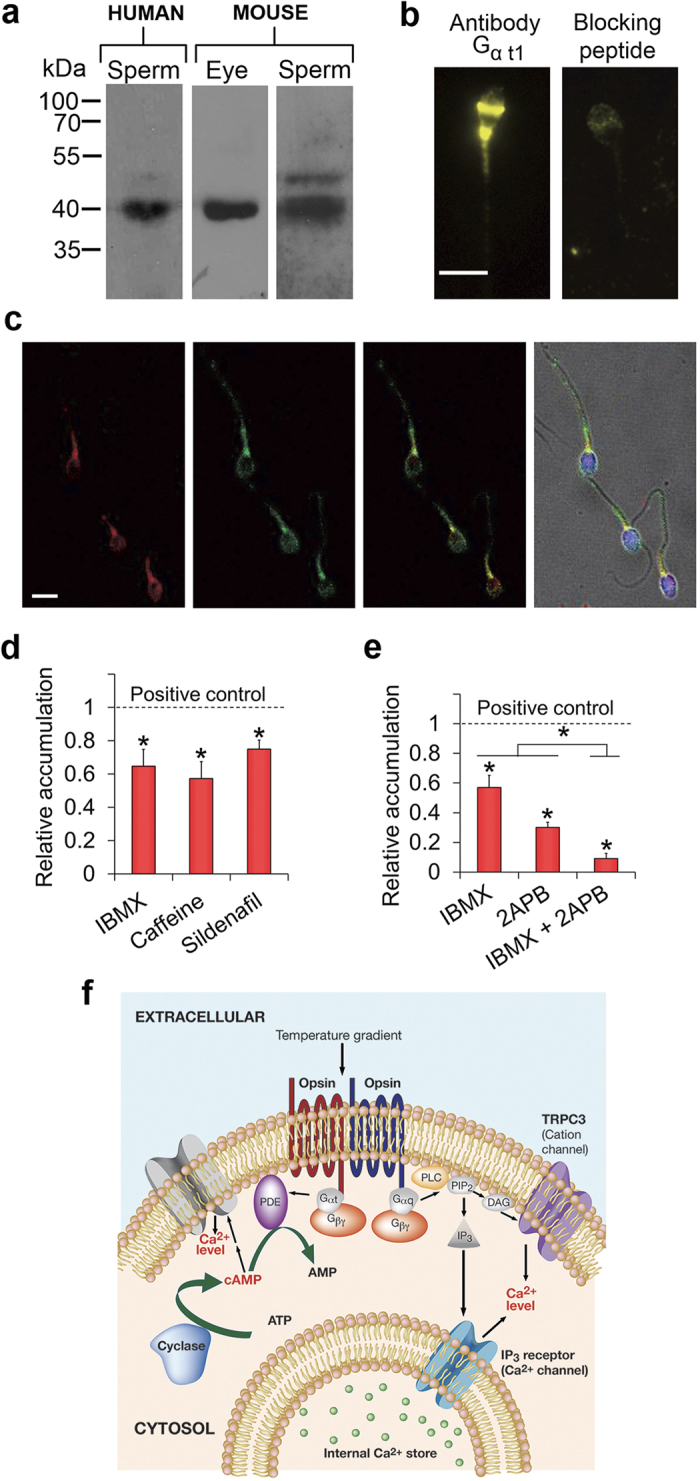
(a) A representative Western-blot analysis of Gα t1 in human and mouse spermatozoa. Mouse eyes were used as a positive control. (b) Localization of Gα t1 in human spermatozoa by immunocytochemical analysis. The right panel is a negative control in which the cells were incubated with both the primary antibody and a specific blocking peptide. Bar = 5 μm. (c) Representative images showing co-localization of Gα t1 and rhodopsin in human spermatozoa, revealed by immunocytochemical analysis. From left to right: Gα t1 (red), rhodopsin (green), G α t1 and rhodopsin together (yellow), nuclei stained with TO-PRO®–3 (blue) overlaid with the double-staining on the bright-field image. No staining was observed in a negative control in which the cells were incubated with the primary antibodies and their specific blocking peptides together. Bar = 5 μm. (d) Effects of PDE inhibitors on sperm thermotaxis, as reflected in the relative accumulation in the warmer compartment. The inhibitors were IBMX (1 mM), caffeine (2 mM), and sildenafil (100 nM). The absolute values of sperm accumulation in the absence of the inhibitors were (165 ± 12)×104, (174 ± 19)×104 and (222 ± 17)×104cells/ml for IBMX, caffeine and sildenafil (mean ± SEM of 13, 16 and 18 determinations, respectively). *P ≤ 0.02 according to two-way ANOVA. The absolute value of the no-gradient accumulation was independent of the presence of inhibitors and ranged between (1–4)×104 cells/ml. (e) Effects of PDE and PLC inhibitors on sperm thermotaxis, as reflected in the relative accumulation in the warmer compartment. The inhibitors were IBMX (1 mM) and 2APB (0.1 mM). The absolute values of sperm accumulation in the absence of the inhibitors was (136 ± 10)×104 (mean ± SEM of 10 determinations). *P ≤ 0.05 according to three-way ANOVA. The absolute value of the no-gradient accumulation was independent of the presence of inhibitors and ranged between (10–17)×104 cells/ml. Since this value was not negligible, we subtracted it from the gradient accumulation values prior to calculating the relative accumulation. (f) A model for two signalling pathways in sperm thermotaxis. The PLC pathway is shown on the right, and the cyclic-nucleotide pathway is shown on the left. See Supplementary Discussion for details. Coloured and grey objects stand for signalling components for which direct evidence exists or is not yet available, respectively.