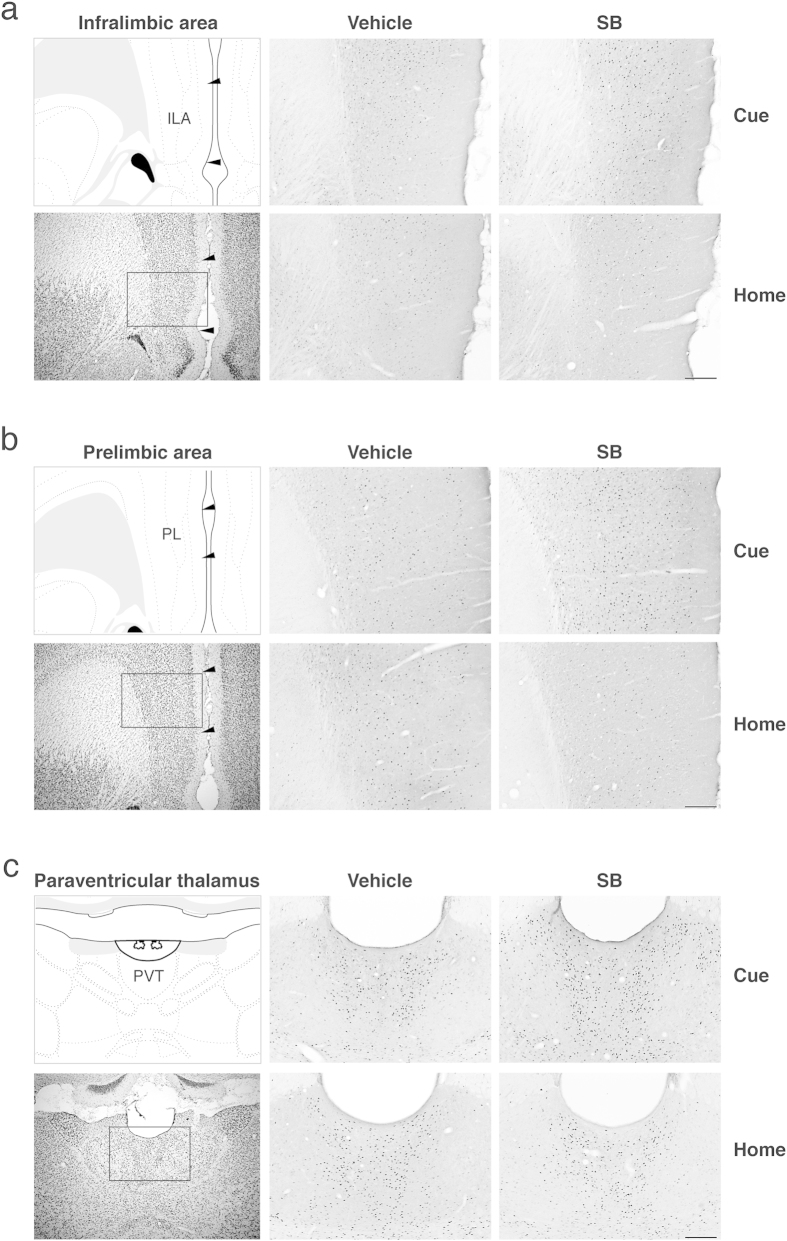
Figure 4.
Representative photomicrographs of Fos induction during the cue test (Cue) or equivalent time period spent in the home cage (Home) in (a) the infralimbic area (ILA), (b) the prelimbic area (PL), and (c) the anterior part of the paraventricular thalamic nucleus (PVT). For each region cytoarchitectonic borders are depicted on a modified atlas template49 and on a corresponding thionin-stained section (left top and bottom panels), and each box depicts the area shown in the corresponding Fos images. Rats were trained with tone-food pairings, and then sated before testing. Following systemic injection of either an OX1R antagonist (SB) or vehicle (VEH), rats were either tested for consumption during tone-food presentations (Cue) or remained in their home cage with no stimuli (Home). Images were captured at 10 x using an Olympus DP72 camera and DP2-BSW software (Olympus America Inc, Center Valley, PA, USA) and processed for contrast, sharpening, and brightness with Adobe Photoshop CS5 (Adobe Systems Incorporated, San Jose, CA, USA). Scale bar = 200 μm.

