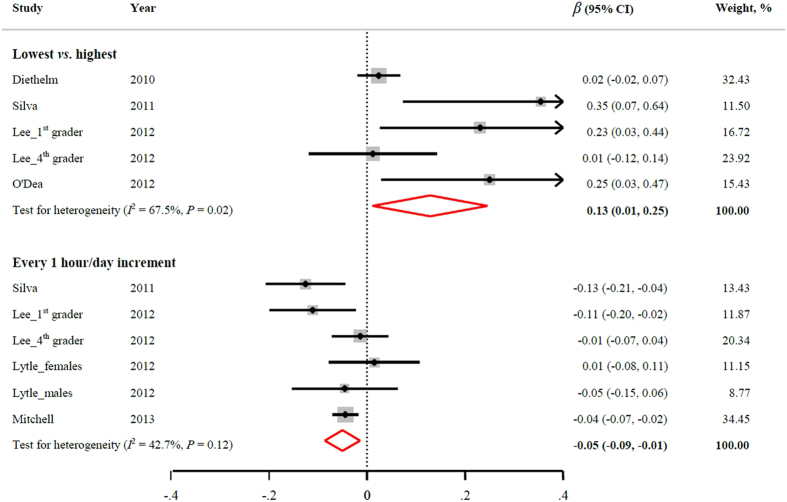
Figure 3. Multivariable-adjusted β coefficient and 95% CI of annual BMI gain in relation to sleep duration.
The overall estimates are obtained by using a random-effects model. The dots indicate the adjusted β coefficients comparing the lowest to the highest levels of sleep duration or every 1 hour/day increment in sleep duration. The size of the shaded square is proportional to the weight of each study. The horizontal lines represent 95% CIs. The diamond indicates the pooled β coefficient. BMI: body mass index; CI: confidence interval.

