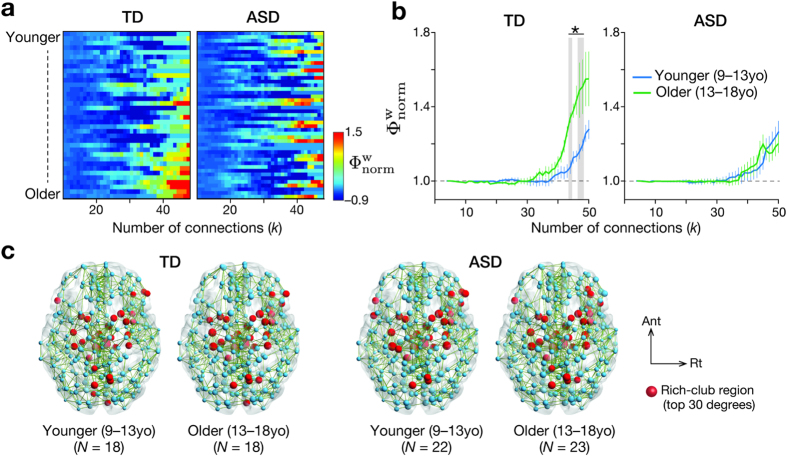
Figure 1.
(a) Normalised rich-club coefficients for all individuals were sorted by age. TD, typically developing individuals; ASD, individuals with autism spectrum disorders. (b) In TD and ASD groups, the normalised rich-club coefficients were consistently >1 when the number of connections (degree, k) was large enough, suggesting rich-club organisation. In TD group, the older (13–18yo) had more apparent rich-club topology than the younger (9–13yo). In ASD group, no such difference was observed. Error bars, std. *PFDR < 0.05 in k = 43, 47, 48. (c) Red circles represent rich-club regions, whereas blue circles show non-rich-club regions. The rich-club regions were defined as regions with top 30 degrees (i.e., the number of connections). For presentation purpose, the maps contain 3% most weighted connections (green lines). Ant, anterior; Rt, right.

