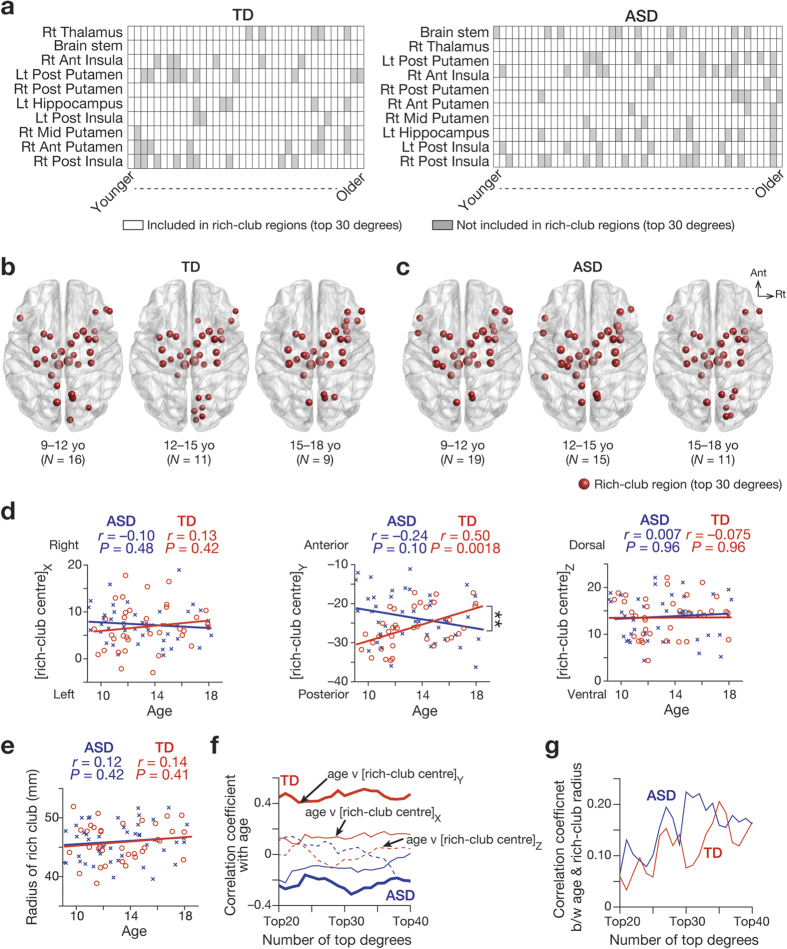
Figure 4.
(a) Brain regions forming rich club. The matrices show patterns of brain regions’ appearing in rich club. Each column represents each individual: a white cell indicates that the region was included in rich-club regions with top 30 degrees; a grey cell indicates the opposite. The displayed regions are the 10 regions that most frequently appeared in rich club for each group. TD and ASD groups shared the 10 representative regions, though their appearance timing of these regions was different. Rt, right; Lt, left; Ant, anterior; Post, posterior; Mid, middle. (b,c) Distribution of rich-club regions. The red circles show the locations of rich-club regions with top 30 degrees of three age groups (Younger: 9 ≤ age < 12; Middle: 12 ≤ age < 15; Older: 15 ≤ age ≤ 18). The size of the circle represents the degree of each region. (d,e) Relationship between age and the rich-club centre and radius. In TD group, Y coordinate of the centre of rich club was positively correlated with age. The correlation was significantly different from that observed in ASD group (P = 0.0006). Such age-associated relationship was not found in X or Z coordinate (panel d), or the radius of rich club (panel e). (f,g) Robustness against the definition of rich-club regions. The correlations between age and locational distribution of rich club were robust against iterating the number of top degrees, which resulted in varying of the number of rich-club regions. Especially, the correlation between age and Y coordinate of the rich club centre was consistently observed in TD group, and its difference between TD and ASD groups were also coherently significant (P < 0.05; thick lines in panel f).

