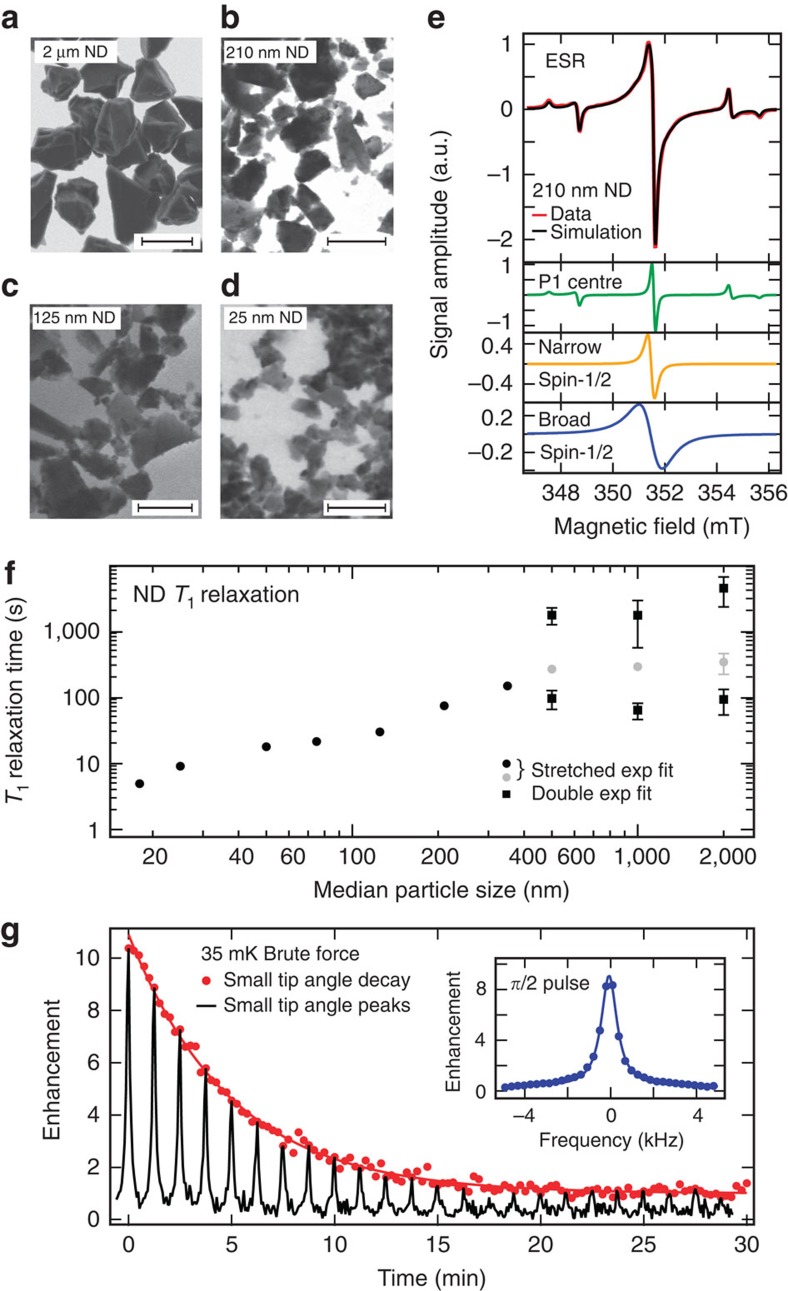
Figure 1. ND characterization and brute force hyperpolarization.
(a–d) Electron micrographs of various sized NDs used in this work. (a) 2 μm ND, scale bar, 2 μm; (b) 210 nm ND, scale bar, 400 nm; (c) 125 nm ND, scale bar, 200 nm; (d) 25 nm ND, scale bar, 100 nm. (e) ESR spectrum of 210 nm ND (red). The black line is a simulated spectrum consisting of three components: a narrow spin-1/2 component (yellow), a broad spin-1/2 component (blue) and a P1-centre component (green). (f) Room temperature 13C relaxation times, T1, as a function of diamond particle size at B=7 T. Relaxation times were measured using the saturation recovery method with build-up time of magnetization M determined by fitting a stretched exponential M=M0(1−exp(−(t/T1)α) or double exponential. Small NDs exhibit a build-up with α=2/3 (black circles), with larger NDs better fitted by a stretched exponential with α=1/2 (grey circles) or double exponential fits with a long and short component shown as black squares. The error bars indicate the s.d. of the three measurements that were taken, and are shown when the error exceeds the size of the marker. (g) Enhanced signal following brute force hyperpolarization of 2-μm ND at T=35 mK and B=4 T for 3 days in a dilution refrigerator. Following a 40 s transfer in a field of 630 mT, detection is at B=7 T, via a π/2-pulse (inset) with decay (T1 ∼53 min) measured via a sequence of small tip angles (main panel).

