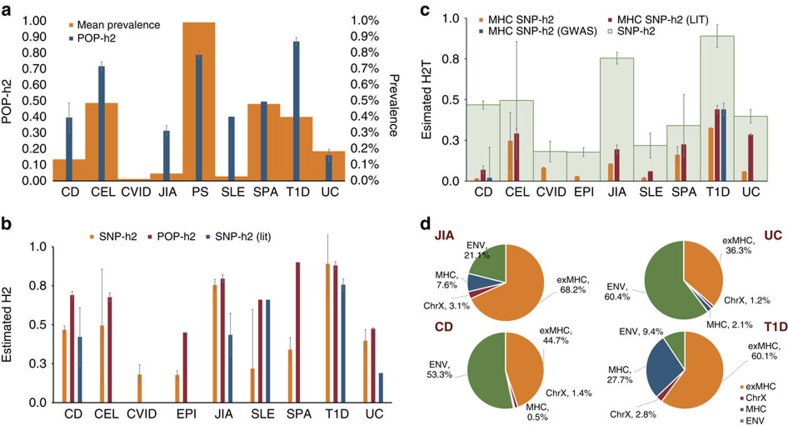
Figure 1. Autoimmune disease prevalence and heritability estimates.
(a) Mean population-based AI disease prevalence (orange) and heritability (blue) estimates (mean±s.d.). Data are curated from epidemiological surveys among Caucasian populations in Europe or North America based on studies indexed in PubMed between 1975 and 2015. Where multiple sources of data are available for a given trait, we reported a simple non-weighted arithmetic mean and provided as error bars the standard deviation. Most heritability estimates were based on twin concordance rates. Raw data used and references can be found in Supplementary Tables 1 and 2. (b) Univariate SNP-heritability (SNP-h2, orange) compared with estimates reported by prior studies. (SNP-h2 (lit), blue) based on variations across the autosomes compared with population-based estimates (POP-h2, red) as reported in the literature (lit). Raw data used from prior GWAS SNP-h2 estimates are provided in Supplementary Table 3. Error bars denote standard error. (c) Univariate SNP-heritability (autosomal) estimates with (Light green, wide) and without the extended MHC (orange, narrow). Results are compared with corresponding heritability estimates reported using population-based (red, narrow) versus other published SNP-heritability estimates (blue, narrow), when available for a given disease. Literature data used and references can be found in Supplementary Table 2 and Supplementary Tables 6 and 7. Error bars denote standard error. (d) Partitioning phenotypic variance to genetic and non-genetic (ENV, green) components in the four largest pAID cohorts. Genetic components include contributions from the entire autosomal regions excluding the MHC (exMHC, orange), the extended MHC (MHC, blue) alone as well as from the X-chromosome (ChrX, red).

