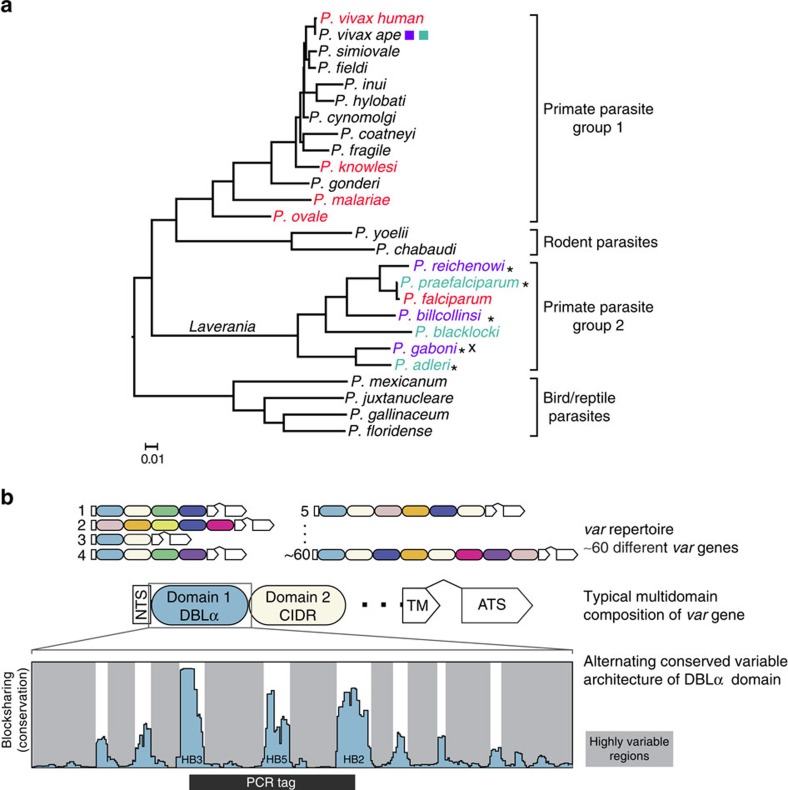
Figure 1. Characterization of Laverania var gene sequences.
(a) Phylogeny of Plasmodium species. The tree was constructed from mitochondrial sequences (2.4-kb spanning cox1 and cytB). The scale bar indicates 0.01 substitutions per site. Colours indicate species infecting humans (red), chimpanzees (purple) and gorillas (aqua). Asterisks indicate successful PCR amplification of var sequences; a cross indicates identification of var-like genes in near-full-length P. gaboni genomes. (b) Three-level schematic of modular var diversity, structure and architecture. Coloured ovals represent classes of DBL or CIDR domains. White boxes represent the N-terminal segment (NTS), transmembrane (TM) and acidic terminal segment (ATS) domains; a wedge between TM and ATS domains indicates the intron that separates the two var exons. Alternating conserved variable architecture is illustrated using blocksharing (see the Methods section) between one representative DBLα domain (DD2var11) and other DBLα domains published by Rask et al19. A black bar indicates the location of the PCR amplified DBLα tag region, which spans three conserved homology blocks (HB3, HB5 and HB2)19, 72–147 amino acids in length.

