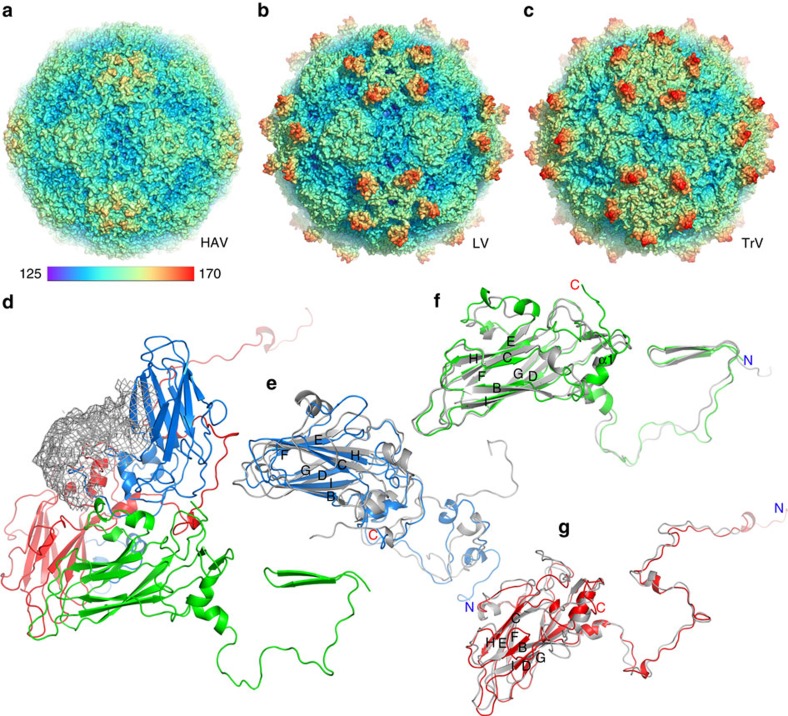
Figure 3. Overall structure of LV.
(a–c) Comparison of capsids from LV (b) with HAV (a) and TrV (c). The capsids are coloured by radius from blue to red according to the scale bar shown. (d) Ribbon diagram of the LV protomer. VP1, VP0 and VP3 are shown in blue, green and red, respectively; the VP1 C-terminal 55 residues that form the surface protrusion around the five-fold axis are shown by a lower-resolution electron density map. (e–g) Ribbon diagrams showing the LV capsid proteins VP1 (e), VP0 (f) and VP3 (g) with the individual strands and termini labelled, compared with those of HAV (grey), the N- and C termini of the LV proteins are labelled in blue and red, respectively.

