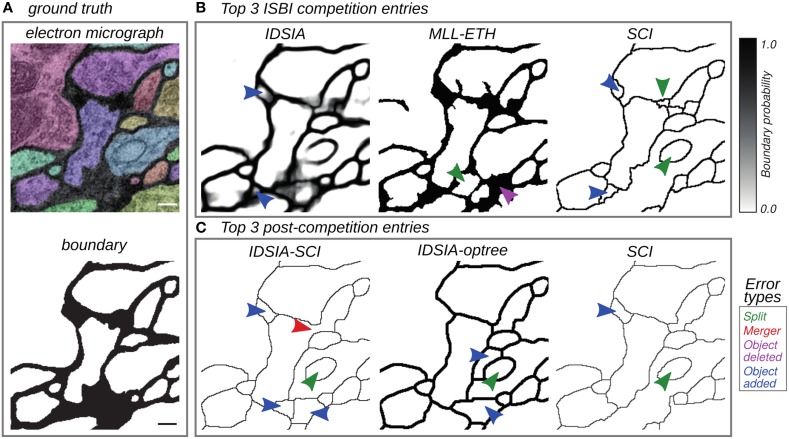
Figure 2.
Top entries from the competition (Section 3.2) and cooperation (Section 3.3) phases of the challenge. (A) Electron micrograph with overlaid segmentation and corresponding boundary map. (B) Boundary maps of the top 3 submissions at the time of ISBI'12. (C) Boundary maps of the top 3 submissions in the cooperation phase. Segmentation errors are marked by arrows colored based on the type of mistake: split (green), merge (red), omission (magenta), and addition (blue). Scale bar = 100 nm.

