
Figure 1. ASB2α triggers FLNa degradation in mouse spleen conventional DCs.
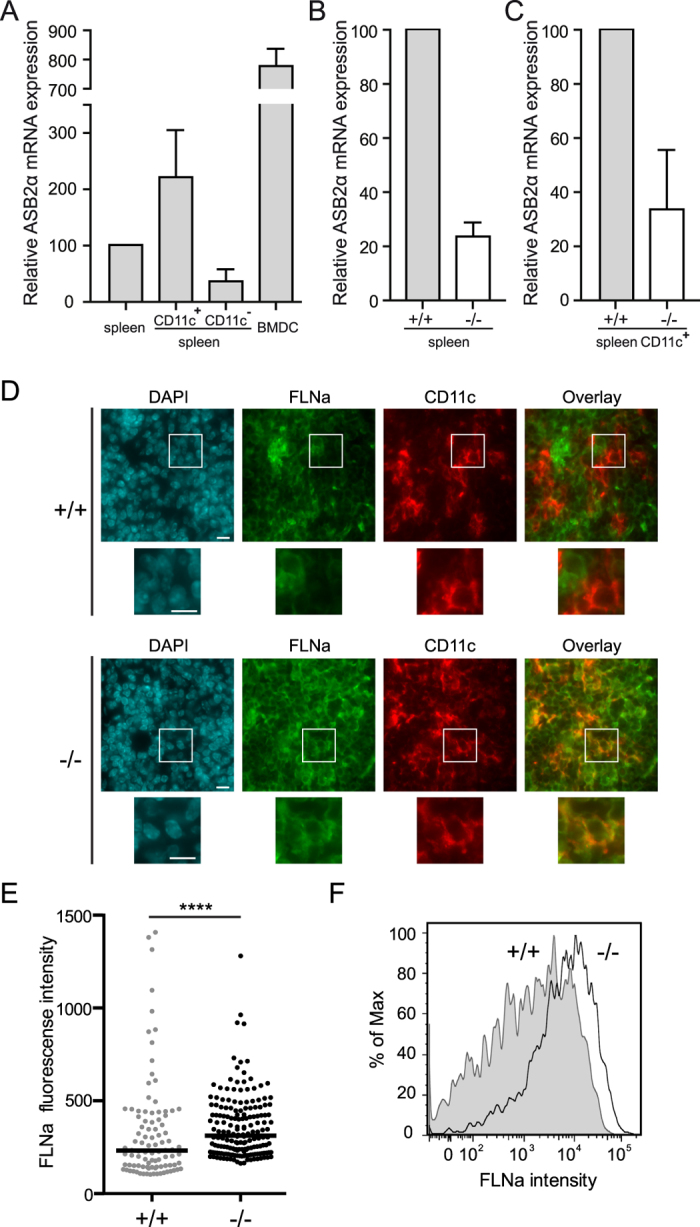
(A–C) Relative expression of ASB2α mRNA assessed by RT-qPCR in spleen, FACS-purified CD11c positive and negative spleen cells and BMDCs of control mice (A) and relative expression of ASB2α mRNA in splenocytes (B) or FACS-purified CD11c positive spleen cells of Mx1-Cre (+/+) and Mx1-Cre;ASB2fl/fl (−/−) mice that have received poly(I·C) (indicated as +/+ and −/−, respectively). Levels were normalized to Arbp. The data show means and SEM of three independent experiments (sample size: +/+ = 15; −/− = 14 except for BMDCs, sample size = 8). (D) Frozen sections of the spleen of Mx1-Cre (+/+) and Mx1-Cre;ASB2fl/fl (−/−) mice that have received poly(I·C) were examined for FLNa, CD11c and DAPI staining. Magnified views are also showed. Scale bars represent 10 μm. One representative experiment is presented. (E) Quantitation of FLNa expression assessed by immunofluorescence in CD11c positive spleen cells of Mx1-Cre (+/+) and Mx1-Cre;ASB2fl/fl (−/−) mice that have received poly(I·C). Cells were centrifuged onto glass slides, fixed and stained for FLNa. Dot plots show the overall distribution of relative FLNa fluorescence intensities, and lines shows the median values. The p-value was calculated using the Mann-Whitney t-test. ****p< 0.0001. (F) Expression of FLNa was assessed by intracellular flow cytometry coupled to extracellular flow cytometry in CD11c high spleen cells. After fixation and permeabilization, cells were stained with anti-FLNa and brilliant violet 421-conjugated anti-rabbit antibodies. Gray and white areas show representative FLNa staining profiles in CD11c high (CD11chi) cells of Mx1-Cre (+/+) and Mx1-Cre;ASB2fl/fl (−/−) mice that have received poly(I·C), respectively. One representative experiment out of three is presented.