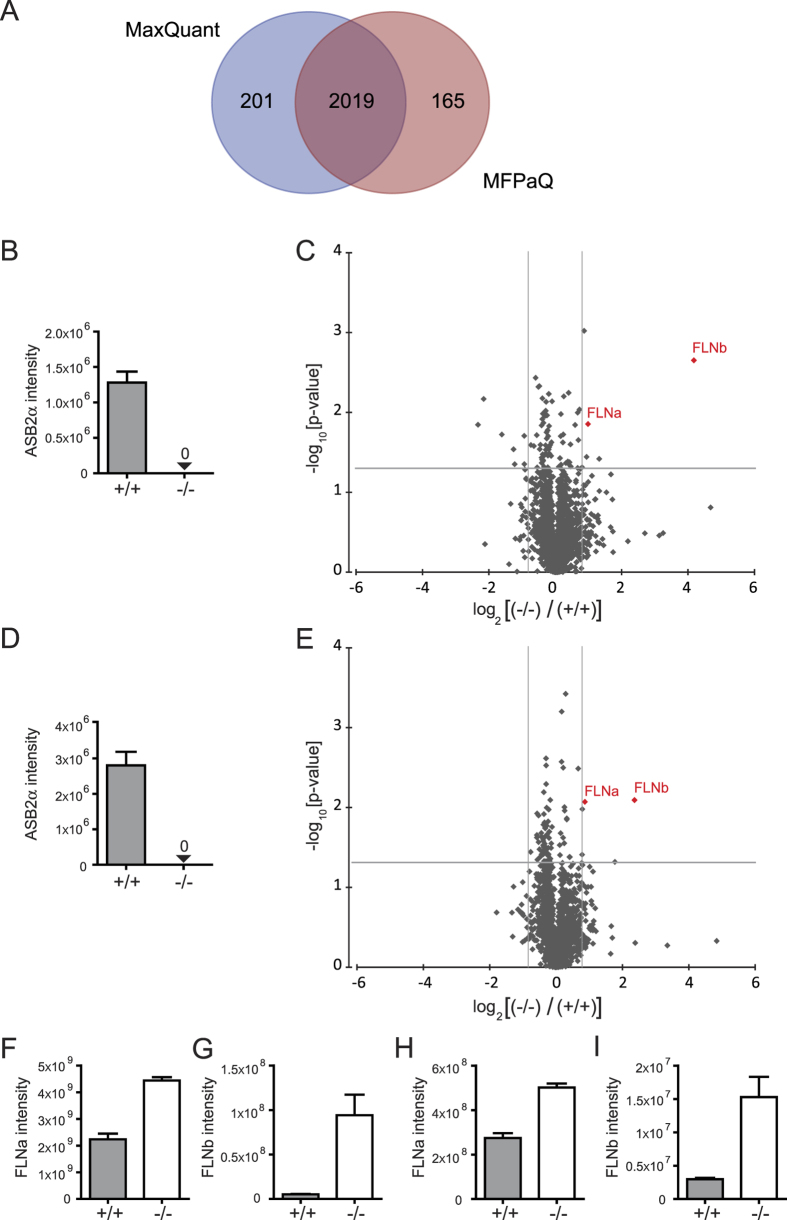
Figure 6. Quantitative protein expression differences between ASB2α−/− and ASB2α+/+ BMDCs.
(A) Venn diagram that shows the overlap between proteins quantified with the two quantitative software, MFPaQ and MaxQuant. (B,D) ASB2α intensities from MaxQuant (B) and MFPaQ (D) quantitative analyses for ASB2α+/+ and ASB2α−/− BMDC extracts. 0 indicates that no peptide was attributed to the ASB2α protein. (C,E) Volcano plots from MaxQuant (C) and MFPaQ (E) quantitative analyses of protein expression differences between ASB2α−/− and ASB2α+/+ BMDCs as a function of statistical significance. Pointed lines mark threshold limits (log2[ratios ASB2α−/− vs. ASB2α+/+]>0.85 or < 0.85; t-test p-value < 0.05) for up- or downregulated proteins. Proteins highlighted in red were found to be variant using both software. (F–I) Intensities of FLNa (F,H) and of FLNb (G,I) calculated using MaxQuant (F,G) and MFPaQ (H,I) quantitative metrics for ASB2α+/+ and ASB2α−/− BMDC extracts.

