
Figure 3.
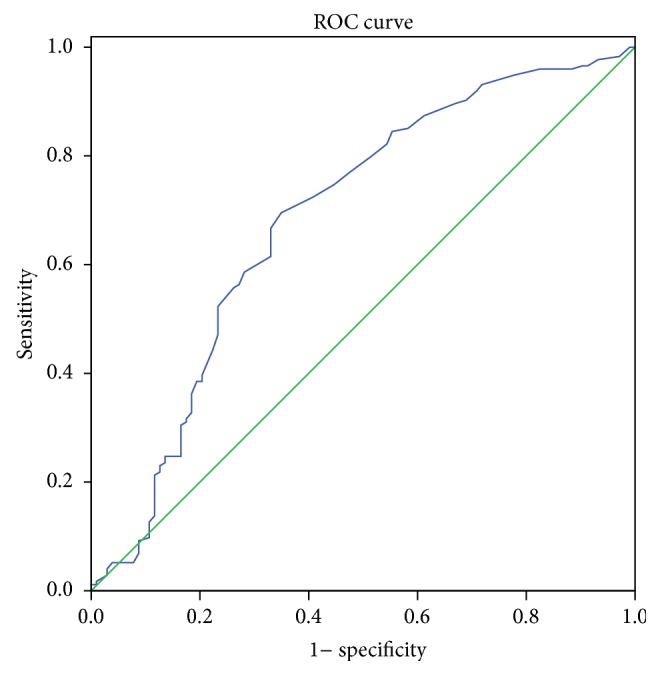
ROC curve for CSS prediction. A ROC curve plots the sensitivity on the y-axis against one minus the specificity on the x-axis. The area under curve (AUC) was used as an estimation of diagnostic accuracy. The AUC was 0.684 (95% CI: 0.616–0.752, P < 0.001). It demonstrated that RDW (cut-off point: 14.5%) predicts survival with a sensitivity of 44.3% and a specificity of 77.7%. Diagonal segments are produced by ties.