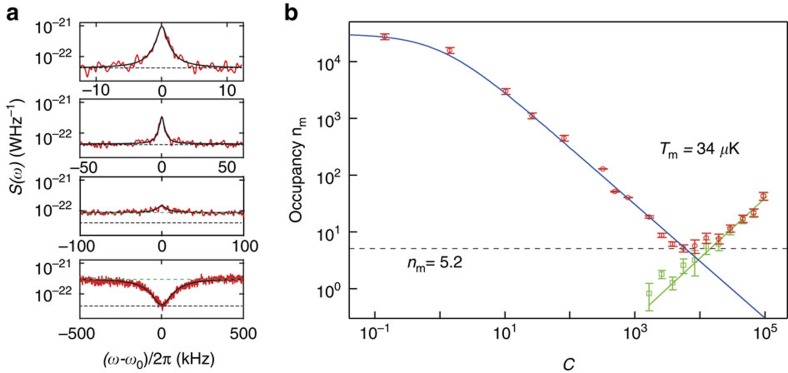
Figure 4. Microkelvin cooling of a millimetre-sized mechanical resonator.
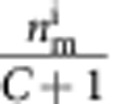
(a) Measured microwave PSD S(ω) with red-sideband driving (top to bottom: C=324, 785, 3,810 and 94,500). Black dashed line: noise floor nadd of the amplifier chain. As the cooperativity C of the cooling tone is increased, S(ω0) is reduced and the mechanical linewdith is broadened. Initially, the thermal noise of the membrane appears as a peak with decreasing height. At higher C (lower two panels), the noise floor outside of the mechanical linewidth (green dashed line) begins to increase above nadd, indicating the presence of cavity noise. In the lowest panel, the output noise of the cavity is suppressed at ω0 due to correlations of the mechanical and cavity fluctuations. From the thermal peak and the cavity noise background level (green dashed line), we extract both nm and nc for all cooling powers (b). As a function of C, the mechanical occupancy nm (red circle) drops, closely following  (blue line) until the onset of cavity noise nc (green squares) limits the final occupancy to a minimum of nm=5.2, corresponding to Tm=34 μK. The error bars indicate the uncertainty of the data points and are calculated with the errors from the Lorentzian fit. The green line in b shows the expected nc from the measured carrier sideband noise of the microwave generator.

