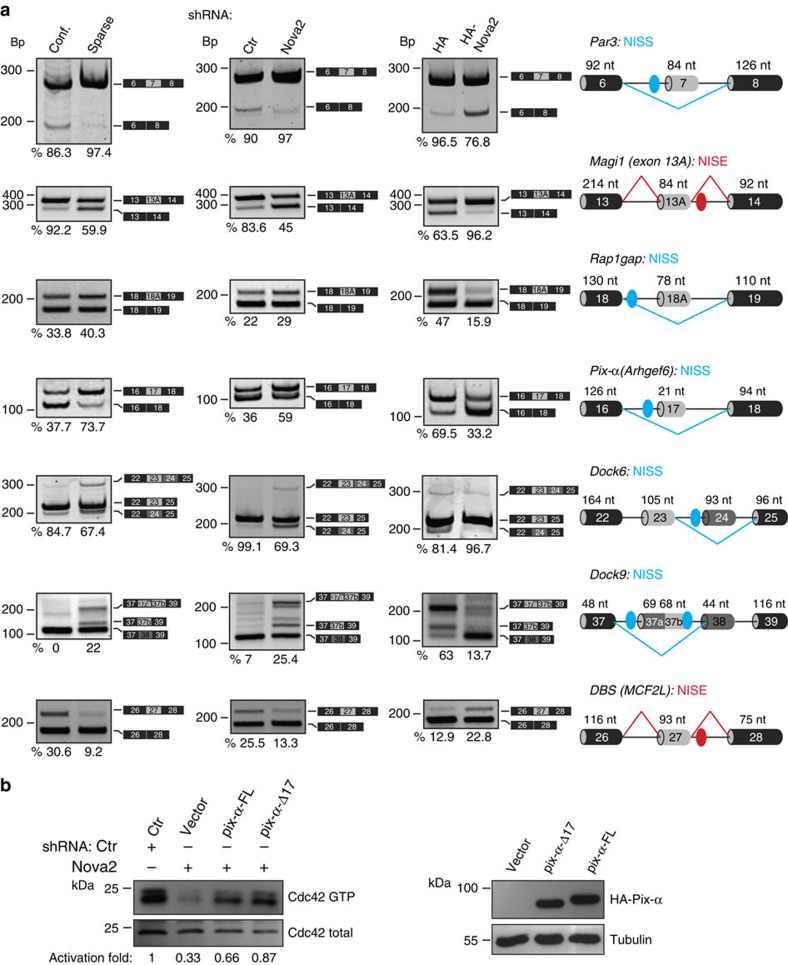
Figure 4. AS changes in Nova2 overexpression and knockdown ECs.
(a) AS of the indicated Nova2 targets as determined using RT–PCR in confluent and sparse mouse ECs (left), in confluent Nova2 knockdown ECs (middle) and in sparse ECs overexpressing HA-tagged Nova2 (right). For each gene, the schematic representations of the genomic region containing the AS exon, the transcripts generated from skipping or inclusion of the AS exon and the calculated percentage of exon inclusion are indicated. For Dock6, the percentage indicates the ratio between the isoform containing exon 23 (skipping exon 24) and total, whereas for Dock9 the percentage is the ratio between the isoform containing exon 37a plus 37b and total. Grey boxes, AS exons; black boxes, constitutive exons; blue/red dots indicate YCAY clusters predicted to function as Nova silencer/enhancer. Blue/red bars indicate Nova-silenced/enhanced exon inclusion. NISS, Nova intronic splicing silencer; NISE, Nova intronic splicing enhancer. (b) In vitro pull down of GTP-bound Cdc42 in Nova2-silenced ECs transfected with the indicated vectors driving the expression of HA-tagged Pix-α deleted of exon 17 (Pix-α-Δ17), Pix-α containing exon 17 (Pix-α-FL) or transfected with the empty vector (vector). The Cdc42 activation fold, calculated as the ratio between GTP-bound Cdc42 and total, is shown (Ctr sample used as a reference value). Pix-α isoform expression was analysed by using anti-HA and Tubulin antibodies.

