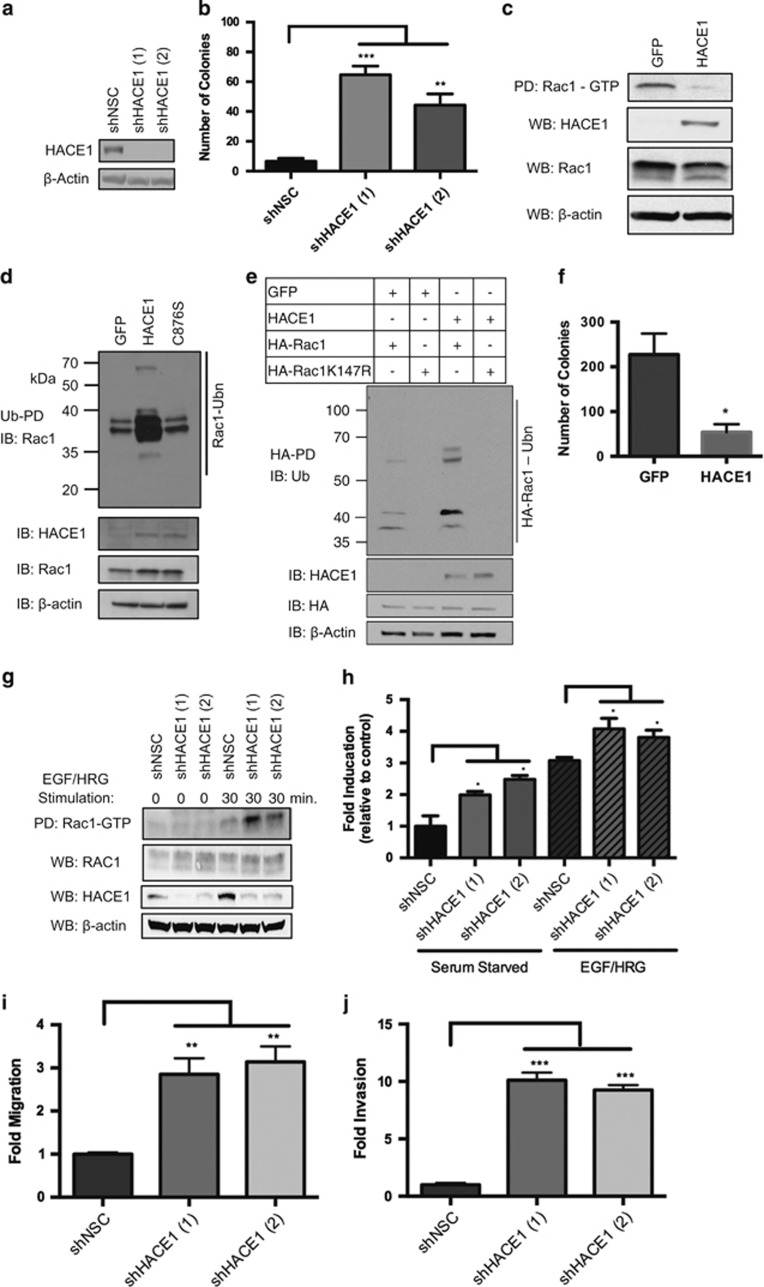
Figure 3.
HACE1 controls transformation through regulation of Rac1. (a) HACE1 expression in MCF12A cells after treatment with two independent HACE1-specific shRNAs (shHACE1, 1 and 2) as determined by western blotting. Non-silencing control (NSC) shRNA is shown as control. (b) Colony formation of MCF12A shHACE1 (1 and 3) and shNSC cells. Data are expressed as mean±s.e.m. of three separate experiments. (c) Rac-GTP levels in MCF7 HACE1 overexpressing and GFP control cells stimulated with EGF and HRG as determined by Rac-GTP pull-down. (d) Immunoblots show Rac1 ubiquitylation in HRG- and EGF-stimulated MCF7 cells expressing GFP control cells, HACE1 and HACE1 C876S cells. Ub cross-linked forms of Rac1 were purified (Ub-enrichment), resolved on 10% SDS–PAGE and detected by immunoblot for Rac1. (e) Immunoblots shows Rac1 ubiquitylation in HRG- and EGF-stimulated MCF7 cells expressing GFP control, HACE1, HA-Rac1 and HA-Rac1K147R. Ubiquitylated HA-Rac was enriched by pull-down, resolved by SDS–PAGE and detected by immunoblot for Ubiquitin. (f) Colony formation of MCF7 GFP control cells and MCF7 HACE1 cells. Data are expressed as mean±s.e.m. of three separate experiments. (g) Rac1-GTP levels in MCF12A shHACE1 (1 and 2) knockdown and shNSC cells as determined by Rac1-GTP pull-down. Cells were stimulated for 30 min with 100 ng/ml EGF and 10 ng/ml HRG after overnight starvation. (h) Rac1 fold activation of MCF12A shHACE1 (1 and 2) and shNSC cells as determined by Rac1 G-LISA. Cells were stimulated for 30 min with 100 ng/ml EGF and 10 ng/ml HRG after overnight starvation. Data from triplicates (fold increase relative to NSC in the absence of stimuli) are presented as mean±s.e.m. of three independent experiments. (i) Migration (Boyden chamber) and (j) invasion (modified Boyden chamber) of MCF12A shHACE1 (1 and 2) and shNSC cells (20 h). A quantity of 100 ng/ml EGF and 10 ng/ml HRG was used as chemoattractant between groups, Student's t-test). Data are expressed as mean±s.e.m. of three separate experiments. (*P<0.01, **P<0.001, ***P<0.0001 between groups, Student's t-test).

