Figure 5.
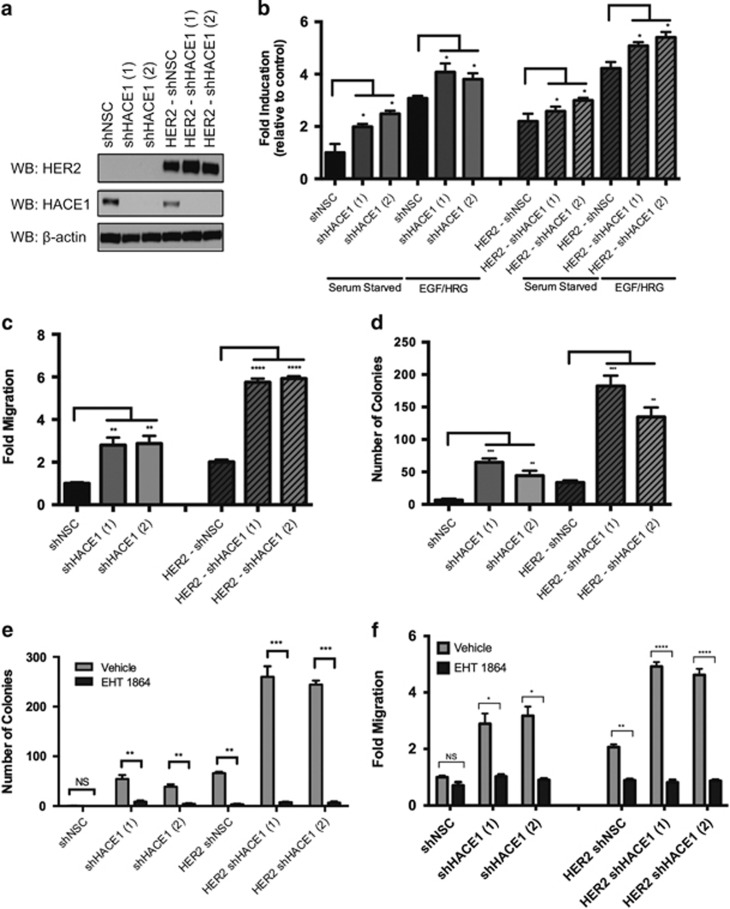
HER2 cooperates with HACE1 to enhance Rac-mediated transformation. (a) HACE1 expression in MCF12A cells and MCF12A-HER2 cells after treatment with two independent HACE1-specific shRNAs (shHACE1 (1 and 2) as determined by western blot analysis. Non-silencing control (NSC) shRNA is shown as a control. (b) Rac1 fold activation of MCF12A shHACE1 (1 and 2), shNSC, HER2 shHACE1 (1 and 2) and HER2 shNSC cells as determined by Rac1 G-LISA. Cells were stimulated for 30 min with 100 ng/ml EGF and 10 ng/ml HRG after overnight starvation. Data from triplicates (fold increase relative to NSC in the absence of stimuli) are presented as mean±s.e.m. of three independent experiments. (c) Migration (20 h) of MCF12A shHACE1 (1 and 2), shNSC, HER2 shHACE1 (1 and 2) and HER2 shNSC cells. A quantity of 100 ng/ml EGF and 10 ng/ml HRG was used as chemoattractant. Data are expressed as mean±s.e.m. of three separate experiments. (d) Soft agar colony formation of MCF12A shHACE1 (1 and 2), shNSC, HER2 shHACE1 (1 and 2) and HER2 shNSC cells. Data are expressed as mean±s.e.m. of three separate experiments. (e) Colony formation of MCF12A shHACE1 (1 and 2), shNSC, HER2 shHACE1 (1 and 2) and HER2 shNSC cells in the presence of 50 μM EHT1864 or vehicle. Data are expressed as mean±s.e.m. of three separate experiments. (f) Migration (20 h) of MCF12A shHACE1 (1 and 2), shNSC, HER2 shHACE1 (1 and 2) and HER2 shNSC cells in the presence of 25 μM EHT1864 or vehicle. A quantity of 100 ng/ml EGF and 10 ng/ml HRG was used as chemoattractant. Data are expressed as mean±s.e.m. of three separate experiments. (*P<0.01, **P<0.001, ***P<0.0001, ****P<0.00001 between groups, Student's t-test).

