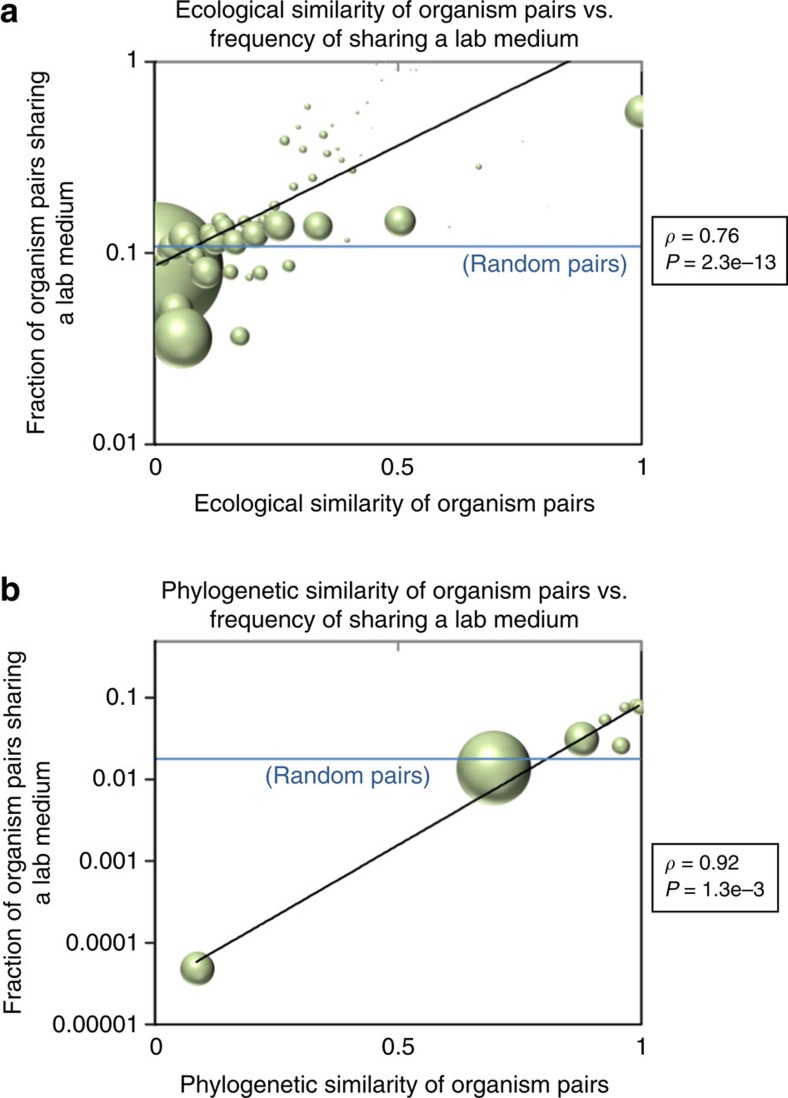
Figure 3. Media usage is correlated with ecological and phylogenetic similarity.
The (a) ecological and (b) phylogenetic distances between pairs of species are plotted versus the fraction of species pairs within each ecological or phylogenetic distance bin that share at least one DSMZ medium. Bubble areas are scaled to the number of organism pairs in each bin. The fraction of random organism pairs of any ecological/phylogenetic distance sharing a lab medium is shown by the horizontal blue line, for reference. Distances are determined by a Jaccard metric of ecological co-growth in Greengenes database (ecological) or by subtree distance (phylogenetic; Methods).

