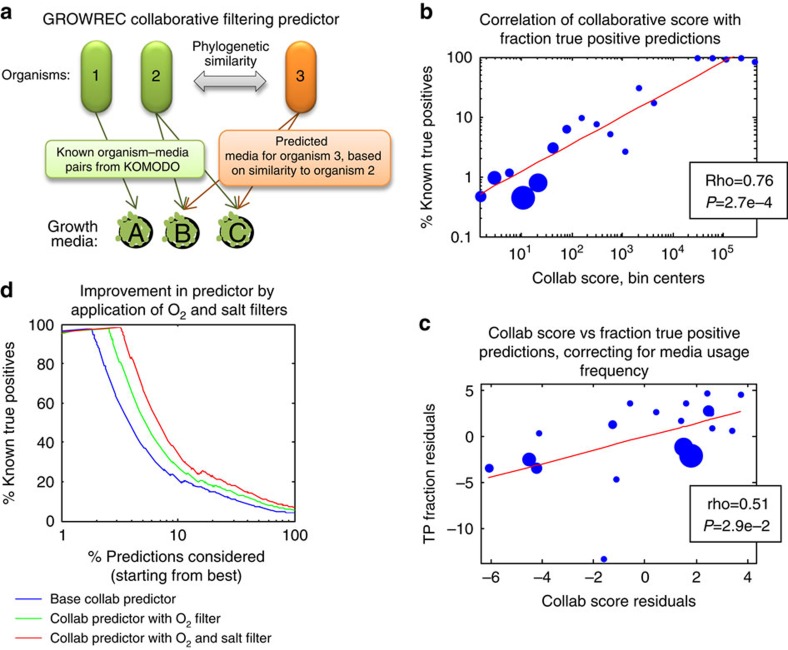
Figure 5. Collaborative filtering predicts media usage.
(a) The concept of collaborative filtering. In brief, the media preferences for a new organism (org3) are predicted based on known preferences of phylogenetically similar organisms (here, org2). (b) Circles represent bins per collaborative score, with diameters proportional to the number of organism–media pairs per bin. Collaborative scores correlate with the true positive fraction (that is, the number of organism–media pairings known in the actual DSMZ database). (c) The partial correlation of collaborative (=collab) score versus true positive fraction, corrected for media usage frequency. (d) The true positive percentages of collaborative filtering predictions from GROWREC are presented with the base predictor, and with oxygen and/or salt filters added on. The x axis shows the % of organism–media pair predictions considered (starting from the one with the highest collaborative score and taking predictions in descending order of collaborative score), and the y axis shows the percentage of predicted organism–media pairs within a given set that are known true positives (that is, are already listed in KOMODO).

