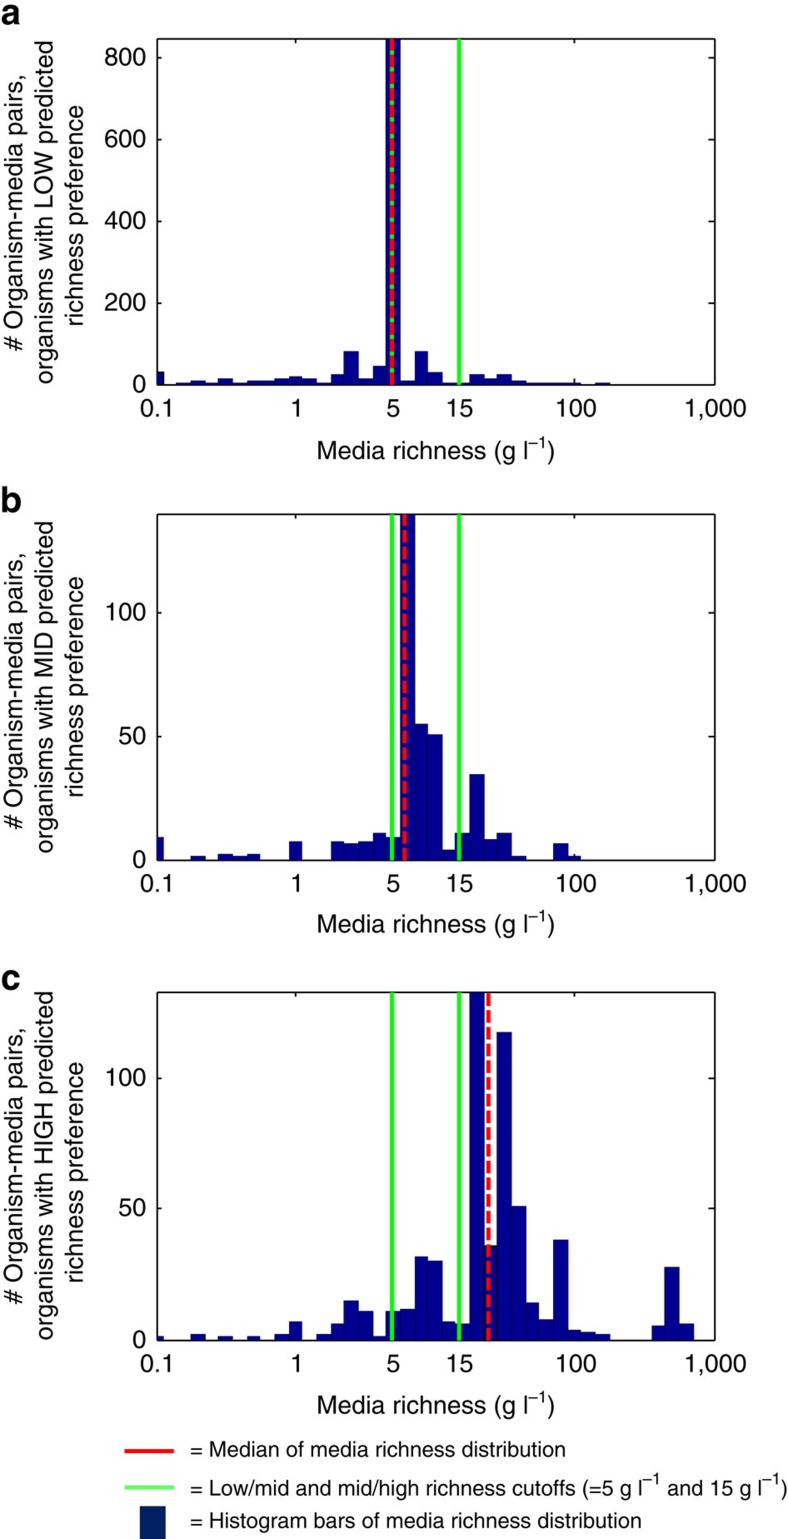
Figure 6. Predicted richness preferences of organisms reflect richness of confirmed growth media.
Organisms are split into three groups based on their predicted richness preferences: (a) low, (b) medium and (c) high. We then plot histograms of the ‘richness' of media paired in the DSMZ repository with organisms within each group. The red vertical line in each plot denotes the median of the distribution, and the green lines denote cutoffs of low/medium and medium/high richness (5 and 15 g l−1, respectively).

