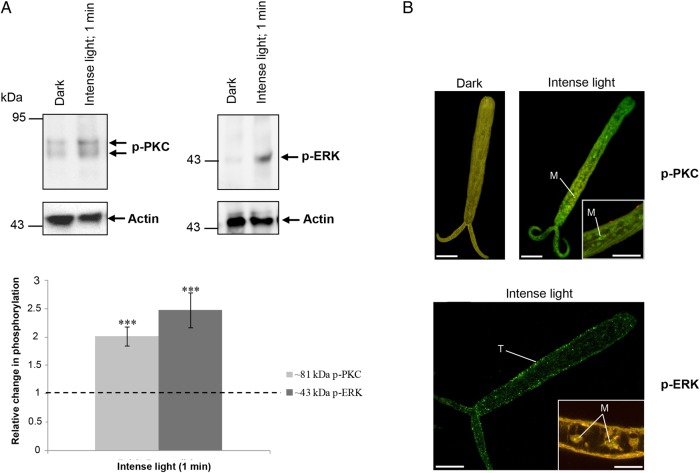
Figure 3.
Illumination rapidly activates protein kinase C (PKC) and extracellular signal–regulated kinase (ERK) in isolated tails of Schistosoma mansoni cercariae. Tails were incubated in dark or intense light for 1 minute at 24°C. A, Proteins were processed for Western blotting with anti-phospho PKC (ζ Thr410) or anti-phospho p44/42 MAPK (ERK) antibodies. Immunoreactive bands were quantified and mean change (±standard error of the mean) in phosphorylation calculated (bottom; n = 6; ***P ≤ .001, by analysis of variance), after normalization for actin, with respect to phosphorylation levels of tails in the dark, which were assigned a value of 1. B, Immunohistochemical analysis of tails with anti-phospho PKC (ζ Thr410) or anti-phospho p44/42 MAPK (green) antibodies. Red (cy3) fluorescence (where shown) reveals actin. Images are maximum projections of approximately 100 z-sections, except when deep scanning was done of specific structures (10–25 z-sections). The scale bar denotes 10 µm. Results are representative of those observed in cercarial populations from 2 independent experiments. Abbreviations: M, myocytes; T, tegument. This figure is available in black and white in print and in color online.

