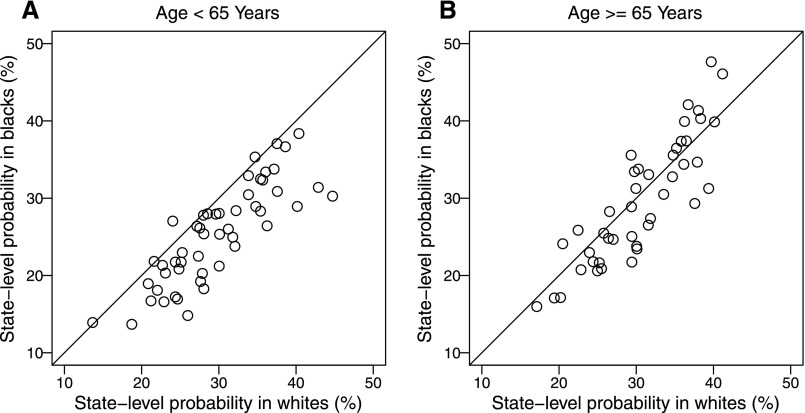
Figure 2.
Model-based estimates of unadjusted state-level probabilities of patients who had received nephrologist care at least 12 months before ESRD for black patients (vertical axis) versus white patients (horizontal axis) by age subgroup. (A and B) The probability estimates for younger blacks, younger whites, older blacks, and older whites were obtained separately from the null model without covariates (model 1). Each dot represents an individual state. The diagonal lines are the equality lines. For age ≥65 years, seven small states (Maine, Vermont, North Dakota, South Dakota, Montana, Wyoming, and Idaho) are not shown.

