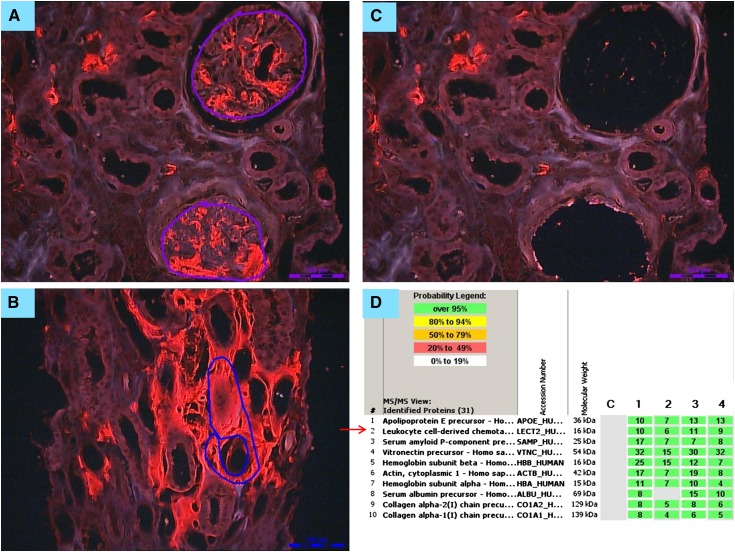
Figure 4.
Laser microdissection/mass spectrometry in a patient with renal amyloidosis derived from leukocyte cell–derived chemotaxin 2 (ALECT2) amyloidosis. (A) Glomerular and (B) interstitial congophilic amyloid deposits visualized under fluorescent light and marked for microdissection. Magnification, ×200. (C) Vacant spaces after microdissection of glomerular amyloid deposits. Magnification, ×200. (D) List of amyloid-associated proteins identified within the deposits by liquid chromatography/mass spectrometry (LC/MS) from a patient with ALECT2 displayed by Scaffold (proteome software). The four columns represent separate microdissected samples run in replicate. The spectra value indicates the total number of mass spectra collected on the mass spectrometer and matched to the protein using the proteomic software. A higher number of mass spectra is indicative of greater abundance of protein and greater amino acid sequence coverage. Our clinical amyloid testing requires a minimum number of four spectra with >95% probability in all samples before the protein identification will be deemed clinically valid. In this case, the presence of abundant spectra for apoE and serum amyloid P is indicative of amyloid, whereas the presence of abundant spectra for leukocyte cell–derived chemotaxin 2 (LECT2) establishes the type as ALECT2 amyloidosis.

