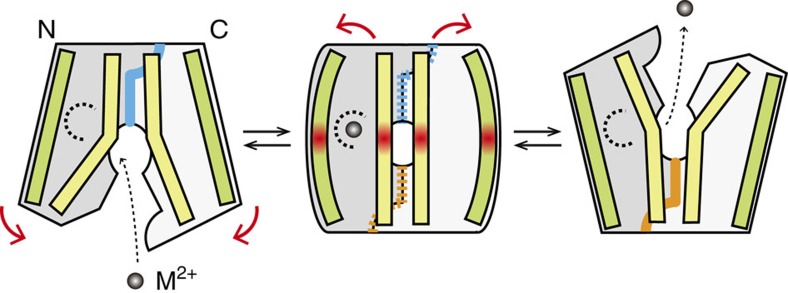
Figure 6. Schematic model of the transport cycle.
Schematic representation of the BbFPN transport cycle. The scaffold helices are coloured green, and the helices at the inter-lobe interface are yellow. The metal-binding site is indicated as a dashed half circle. The intracellular gate interactions and the extracellular gate interactions between the two lobes are schematically represented as orange and blue lines, respectively. In the occluded state, which is shown in the middle, the distortions of the helices are indicated as red gradations. The incomplete formation of the gate interactions is indicated by dashed lines.

