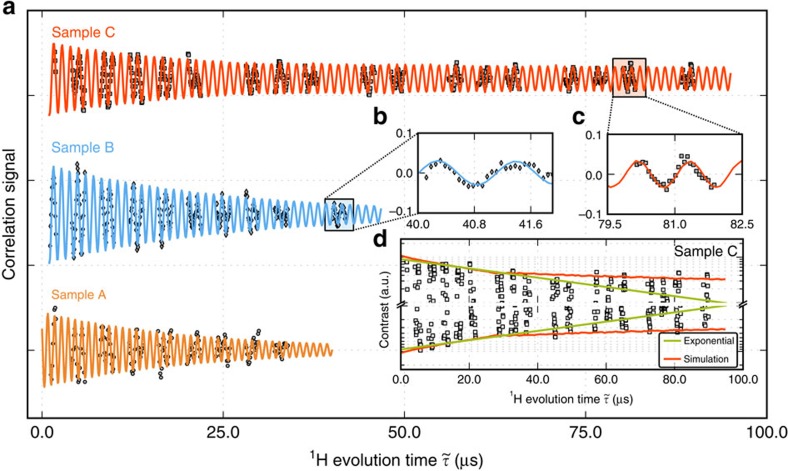
Figure 3. XY8-3 correlation signals for three different organic samples.
(a–c) The data corresponding to both solid samples (samples A and B, respectively, orange and blue traces) match an exponentially damped sinusoid with time constants of ∼21 and ∼29 μs. By contrast, the correlation signal from protons in sample C exhibits a long-lived tail that outlives the exponential decay at early times (green trace in the (d)). The overall response can be reproduced semi-quantitatively via a model comprising a 1.5-nm layer of adsorbed molecules rotating about fixed positions and an outer section of self-diffusing fluid. Best agreement with the experimental observations is attained assuming translational and rotational diffusion constants of 0.3 nm2 μs−1 and 0.05 rad2 μs−1 for the outer and inner layers, respectively (red sinusoid trace in a and red envelope in d). Given the relatively low fluorescence contrast, only portions of the signal were measured. Though obtained with different NVs, each curve must be considered representative of the NV response for the corresponding proton ensemble under study.

